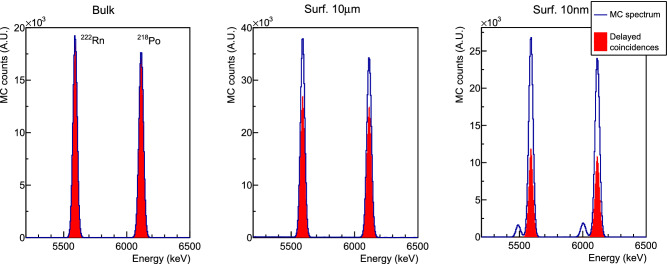
Fig. 5.
Monte Carlo spectra of U decay chain, zoomed on Rn and Po peaks, obtained by simulating the contaminants in the crystal bulk (left), and on crystal surfaces with depth parameters of 10 m (center) and 10 nm (right). The fraction of Rn–Po delayed-coincidences (highlighted in red) over the total events recorded at the Q value peaks decreases as the contaminants are simulated in a thinner surface layer due to -particle escapes. The small peaks appearing in the rightmost plot are due to recoil escapes occurring when contaminants are simulated in a very shallow surface layer ( nm)

