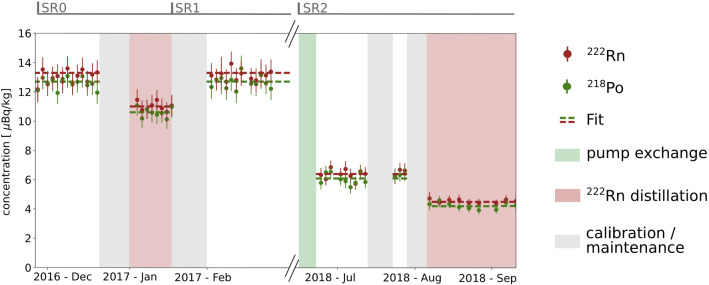
Fig. 3.
The activity concentration evolution of Rn and Po during XENON1T data-taking. In science run 0 and 1 (SR0 and SR1) the activity concentrations were stable over the entire time and we only show the initial period here. Xenon distillation campaigns to remove Rn as well as the exchange of the recirculation pumps lead to a reduction of the Rn and Po activity concentration. They gray regions indicate periods of detector calibration or maintenance

