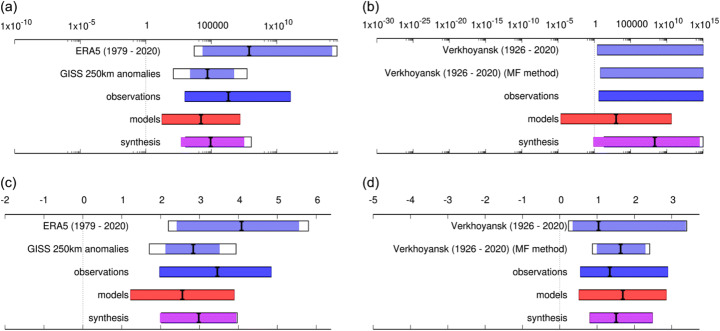
Fig. 4.
Synthesis of probability ratios (PR) ((a), (b)) and changes in intensity in °C ((c), (d)) from the attribution analysis of January–June mean Siberian region temperatures (left) and June TXx at Verkhoyansk station (right). For interpretation of filled/unfilled 95% confidence intervals, see main text. For results including all models, see SI (Figs. S5, S6 and Tables S3, S4). Date ranges indicate full dataset length available for analysis

