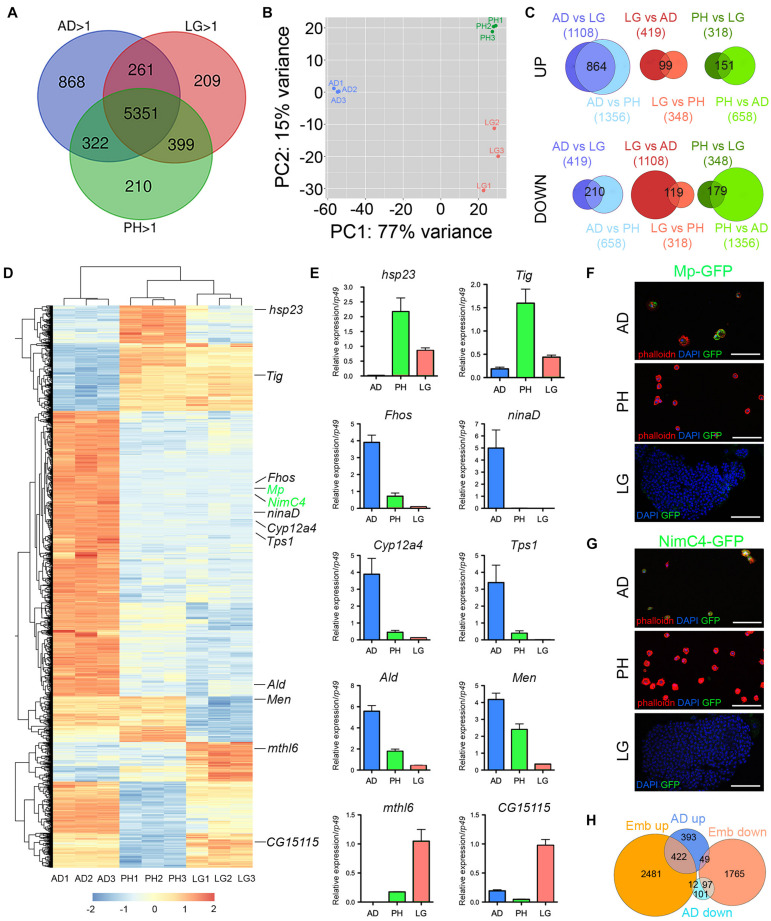
FIGURE 2.
Analysis of adult blood cell gene expression profile. (A) Venn diagrams showing the number of genes expressed (RPKM > 1 in all three biological replicates) in adult hemocytes (AD), larval peripheral hemocytes (PH) and larval lymph glands (LG) as determined by RNA-seq on w1118 females. (B) Principal component analysis of the RNA-seq profiles of adult, peripheral and lymph gland biological triplicates. (C) Venn diagrams showing the overlaps between differentially expressed genes in pairwise comparisons (adjusted p-value < 0.01 and fold change > 2). Upper panels: up-regulated genes. Lower panels: down-regulated genes. The number of up- or down-regulated genes in each condition is indicated in brackets and the number of genes commonly deregulated is indicated in the Venn diagram intersection. (D) Heat map of the genes differentially expressed between adult versus larval hemocytes. The genes tested in panels E to G are indicated. (E) The expression level of the indicated genes was determined by RT-qPCR on adult hemocytes, larval peripheral hemocytes and larval lymph glands. Expression levels were normalized to rp49. Means and SEM from three independent experiments are represented. (F,G) Confocal images showing GFP expression in adult and larval hemocytes from Mp-GFP (F) or NimC4-GFP (G) reporter lines. Nuclei were stained with DAPI (blue). For adult and larval peripheral hemocytes (upper and middle panels), the samples were stained with phalloidin (red). Lower panels show a lymph gland anterior lobe. Scale bar: 50 μm. (H) Venn diagrams showing the overlaps of up- or down-regulated genes between adult versus larval hemocytes (AD, blue) or embryonic versus larval hemocytes (Emb, orange).

