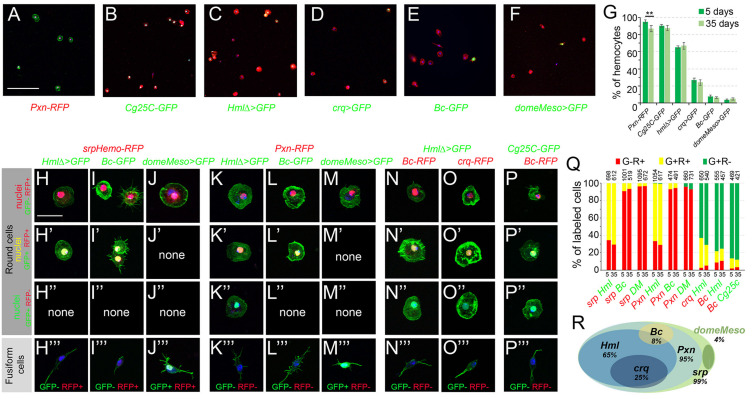
FIGURE 3.
Analysis of blood cell transgenic markers in adult bleeds. (A–F) Confocal views showing representative bleeds from 5-day-old flies carrying the following transgenes: Pxn-RedStinger (A, Pxn-RFP), Cg25C-GFP (B), HmlΔ-GAL4,UAS-2xEYFP (C, HmlΔ>GFP), crq-GAL4,UAS-2xEYFP (D, crq>GFP), BcF2-GFP (E, Bc-GFP), domeMeso-GAL4,UAS-2xEYFP (F, domeMeso>GFP). Cells were counterstained with phalloidin (A: green, B–F: red) and DAPI (blue). Scale bar 200 μm. (G) Quantifications of blood cell proportions expressing the indicated transgenes in 5- or 35-day-old flies. Means and standard deviations from four to six independent experiments are represented. From 200 to 600 DAPI+ cells were scored in each experiment. **p < 0.01 (Student’s t-test). (H–P) High magnification views showing the different types of blood cells observed in bleeds from 5-day-old flies carrying the following combination of transgenes: srpHemo-His2A-RFP, HmlΔ-GAL4,UAS-2xEYFP (H), srpHemo-His2A-RFP, BcF2-GFP (I), srpHemo-His2A-RFP, domeMeso-GAL4,UAS-2xEYFP (J), Pxn-RedStinger, HmlΔ-GAL4,UAS-2xEYFP (K), Pxn-RedStinger, BcF2-GFP (L), Pxn-RedStinger, domeMeso-GAL4,UAS-2xEYFP (M), HmlΔ-GAL4,UAS-2xEYFP, BcF6-mCherry (N), HmlΔ-GAL4,UAS-2xEYFP, crq-RedStinger (O), Cg25C-GFP, BcF6-mCherry (P). GFP and RFP signals are nuclear; cells were counterstained with DAPI (blue) and phalloidin (green). The top three panels show round cells expressing or not RFP and/or GFP; the bottom panels (”’) show fusiform cells together with their GFP/RFP expression status. Scale bar 20 μm. (Q) Quantifications of the proportion of cells expressing the indicated combination of markers in 5- or 35-day-old flies. Mean values from at least three independent experiments are presented. No significant difference (Student’s t-test p < 0.05) was observed in the proportion of GFP+RFP+, GFP+RFP– or GFP–RFP+ blood cell populations between 5- and 35-day-old flies. The total numbers of GFP+ and/or RFP+ cells scored are indicated at the top of each column. (R) Schematic representation of the adult hematopoietic landscape. The proportion of cells expressing each marker is indicated.

