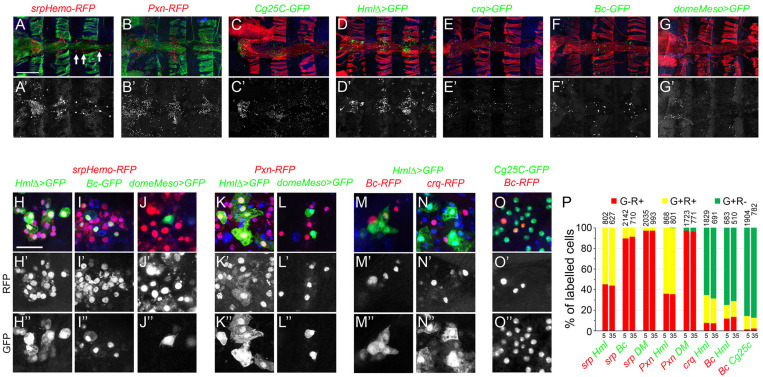
FIGURE 4.
Analysis of blood cell transgenic markers in the adult abdomen. (A–F) Confocal views of the abdominal segments A1 to A4 of 5-day-old females carrying the following transgenes: srpHemo-His2A-RFP (A), Pxn-RedStinger (B), Cg25C-GFP (C), HmlΔ-GAL4,UAS-2xEYFP (D), crq-GAL4,UAS-2xEYFP (E), BcF2-GFP (F), domeMeso-GAL4,UAS-2xEYFP (G). Cells were counterstained with phalloidin (A,B: green; C–G: red) and DAPI (blue). Arrows in panel (A) indicate pericardial cells expressing srpHemo. The lower panels show only the transgene expression. Scale bar 200 μm. (H–O) High magnification views of hemocytes in the abdominal hematopoietic hubs (heart region in A1 or A2 segments) of 5-day-old females carrying the following transgenes: srpHemo-His2A-RFP, HmlΔ-GAL4,UAS-2xEYFP (H), srpHemo-His2A-RFP, BcF2-GFP (I), srpHemo-His2A-RFP, domeMeso-GAL4,UAS-2xEYFP (J), Pxn-RedStinger, HmlΔ-GAL4,UAS-2xEYFP (K), Pxn-RedStinger, domeMeso-GAL4,UAS-2xEYFP (L), HmlΔ-GAL4,UAS-2xEYFP, BcF6-mCherry (M), HmlΔ-GAL4,UAS-2xEYFP, crq-RedStinger (N), Cg25C-GFP, BcF6-mCherry (O). The lower panels show only the red (H’–O’) or the green (H”–O”) channel. Nuclei were stained with DAPI (blue). Scale bar 50 μm. (P) Quantifications of the proportion of cells expressing the indicated combination of markers in 5- or 35-day-old flies. Mean values from at least three independent experiments are presented. No significant difference (Student’s t-test p < 0.05) was observed in the proportion of GFP+RFP+, GFP+RFP– or GFP–RFP+ blood cell populations between 5- and 35-day-old flies. The total numbers of GFP+ and/or RFP+ cells scored are indicated at the top of each column.

