
FIG 3.
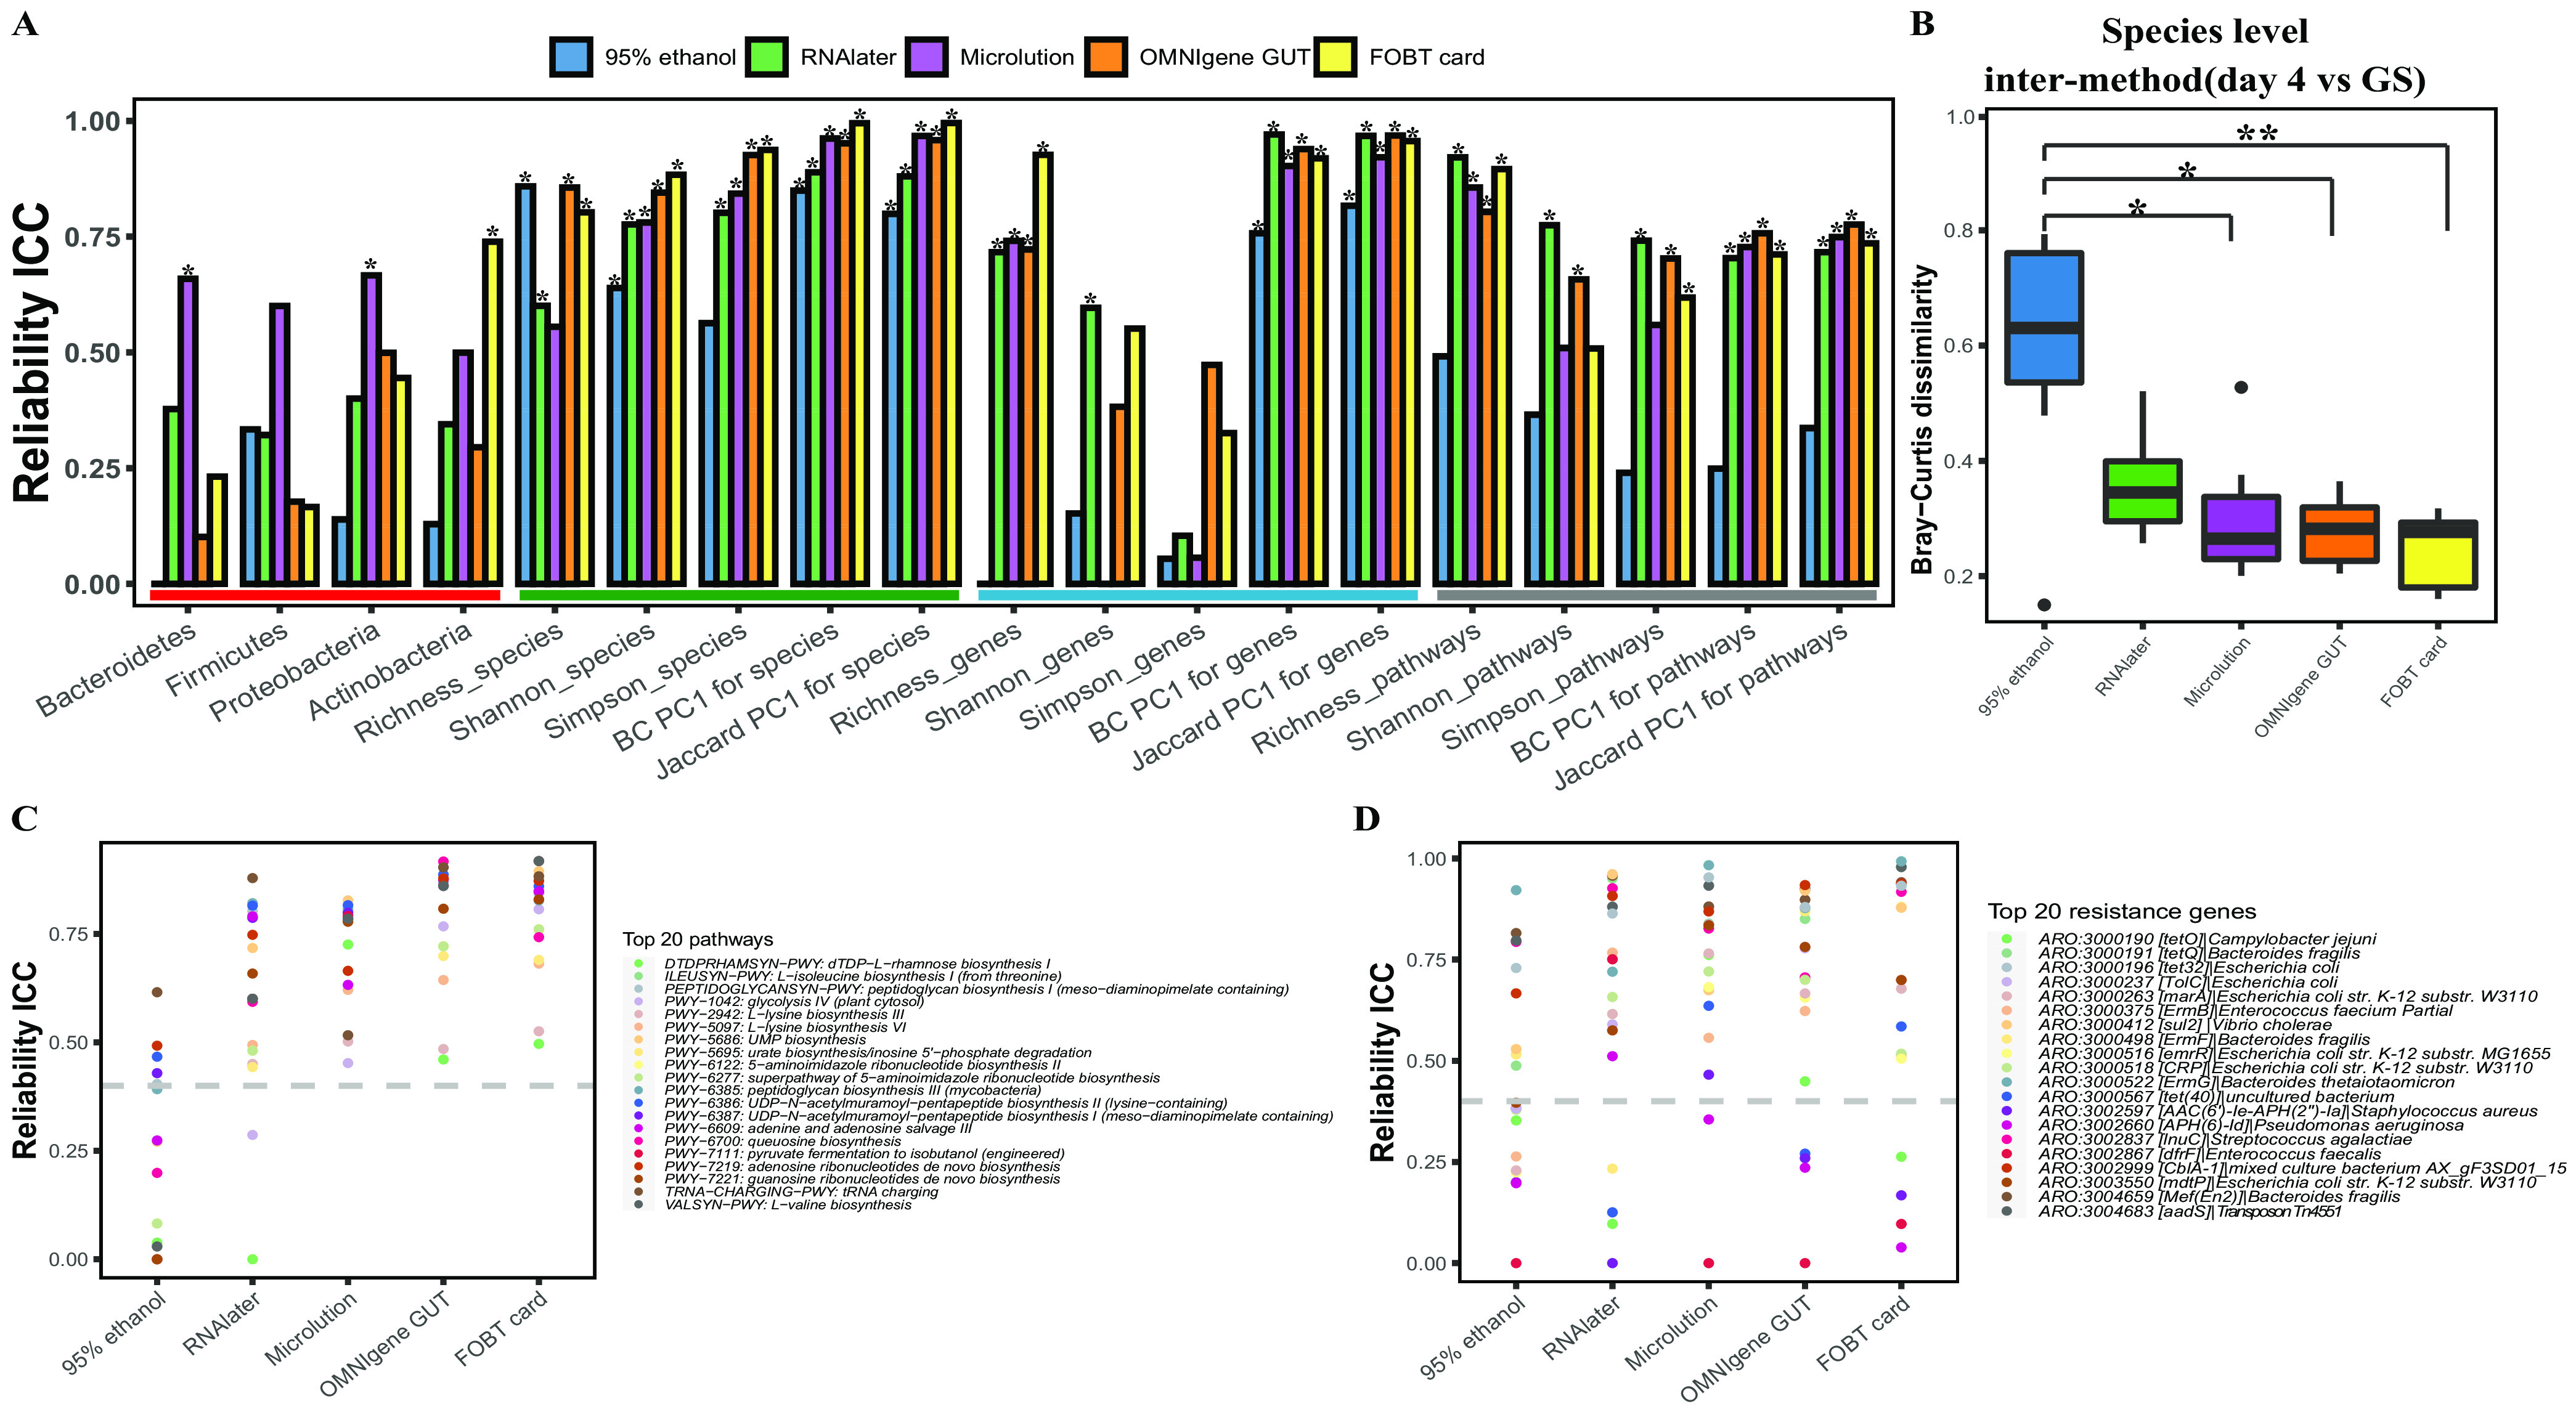
Reliability evaluation of the microbiome. (A) Microbiome metrics calculated using intraclass correlation coefficients (ICCs) included the abundances of four major phyla (red-underlined box) and 15 diversity metrics, including 5 at the species level (green-underlined box), 5 at the gene level (blue-underlined box), and 5 at the pathway level (gray-underlined box). The asterisks on some bars represent a P value of <0.05 for the corresponding measurement indices for ICCs using a two-sided test. (B) Intermethod β-diversity dissimilarities between each method (day 0) and the gold standard (GS) based on Bray-Curtis distance at the species level. Box plots show the intermethod Bray-Curtis dissimilarities at different time points. Each panel indicates Bray-Curtis dissimilarities between samples collected with the GS and those collected with another method. Each box represents the range between the first and the third quartiles, and the vertical lines inside the boxes represent the medians. Kruskal-Wallis tests were performed among multiple-comparison groups, and post hoc Dunn’s multiple-comparison tests were performed on Bray-Curtis dissimilarities between samples collected with each method and frozen on day 4 and the GS samples. * represents an FDR-adjusted Dunn P value of <0.05; ** represents an FDR-adjusted Dunn P value of <0.01. (C and D) Evaluation of the 20 most abundant pathways (C) and resistance genes (D) using ICCs.