
FIG 3.
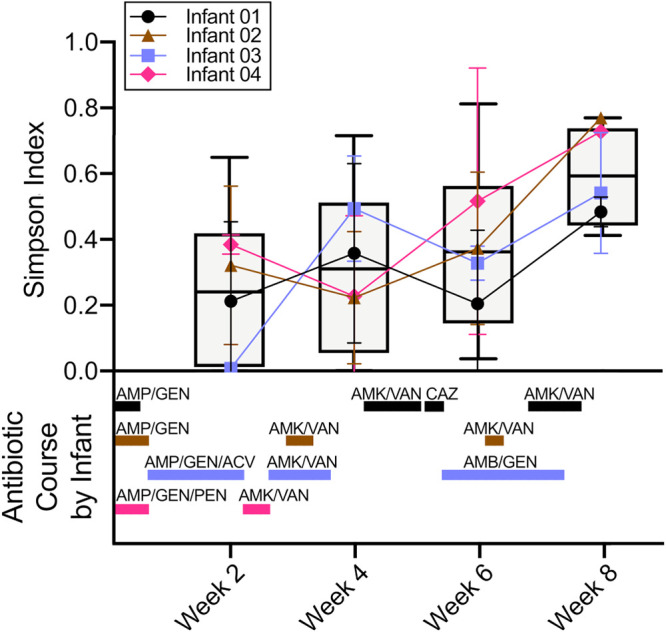
Microbiome diversity on preterm infant skin over time. (Top) Average Simpson index of species in skin swabs over time and for each infant shown with a line graph. Each infant is represented by a different color and symbol, and each point represents the average of the Simpson index from that week. The error bars represent the standard deviation. Boxplots represent the Simpson index for all infants combined. (Bottom) The duration of antibiotic treatments given to the infants during the course of this study. Each infant is represented by the same colors as the top panel. AMP, ampicillin; GEN, gentamicin; AMK, amikacin; VAN, vancomycin; CAZ, ceftazidime; ACV, acyclovir; AMB, amphotericin B; PEN, penicillin.