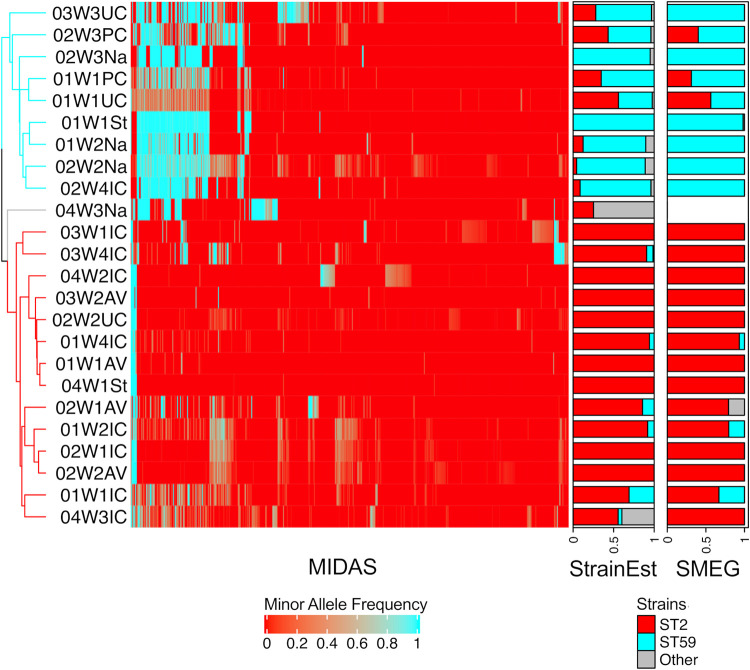
FIG 4.
Identification of S. epidermidis strains in the preterm infant microbiome by three different methods. The heatmap was generated using the allele frequencies of 3,051 biallelic SNPs identified in the samples by MIDAS after quality filtering with default parameter values. The dendrogram on the left represents complete linkage clustering of allele frequencies based on Euclidean distances and is colored according to strain. On the right are bar charts representing the proportions of each strain identified in the samples by StrainEst and SMEG, respectively. ST2 is represented in red, ST59 is represented in cyan, and other STs are represented in gray.

