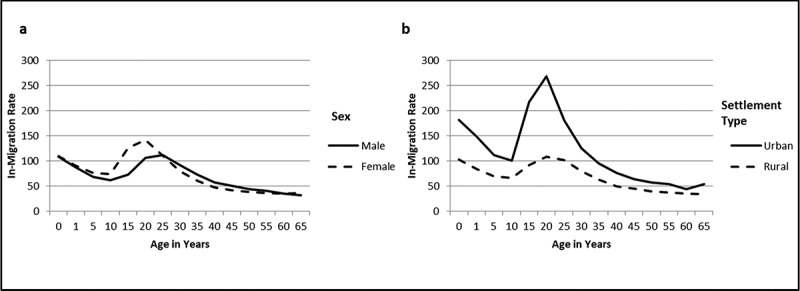
Figure 2.

(a, b) In-migration patterns by sex and settlement type1
1In-migration patterns differ significantly by sex (HR = 1.13, 95% CI 1.12–1.13) and settlement type (HR = 0.48, 95% CI 0.48–0.49).

(a, b) In-migration patterns by sex and settlement type1
1In-migration patterns differ significantly by sex (HR = 1.13, 95% CI 1.12–1.13) and settlement type (HR = 0.48, 95% CI 0.48–0.49).