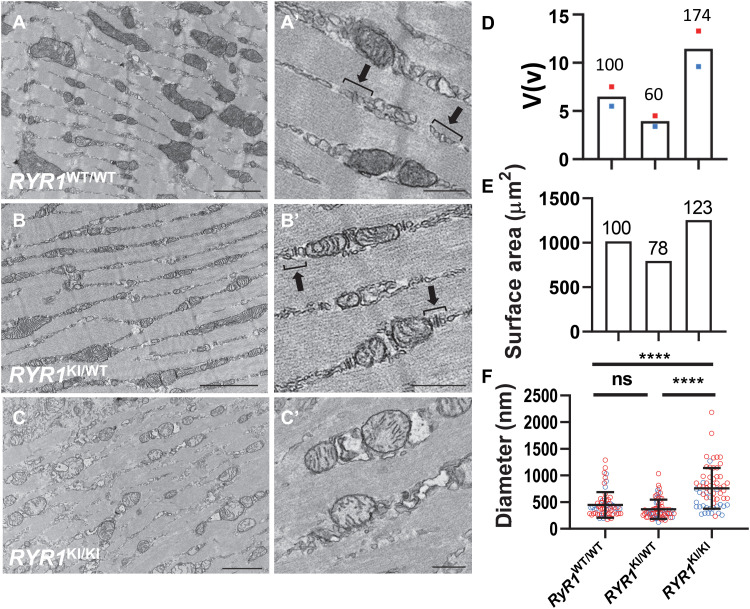
Fig. 4. Mitochondrial morphology changes in RYR1 KI mouse muscle. Ca2+ content.
(A, A′, B, and B′) Electron micrographs of muscle from WT and HET, respectively, show normal sarcomeric and triad structure. (C and C′) Less defined triads and circular morphology of mitochondria in HOM. Images in (A′), (B′), and (C′) represent higher magnification images of areas in (A), (B), and (C) indicated by asterisk. Normal triad structures are denoted by parentheses in (A′) and (B′). Scale bars, 2 μm (A to C), 500 nm (A′ to C′). Mitochondrial ultrastructural parameters in WT, HET, and HOM were as follows: (D) Volume [as a % of cytoplasm, V(v)]. Relative volume to WT (in %) indicated above column. Colored dots are from male (blue) and female (red) mice, and column shows average value. (E) Surface area (μm2) calculated by measuring surface-to-volume ratio (Sv) multiplied by volume in (D). Relative surface area to WT (in %) indicated above column. (F) Mitochondrial diameter (nm; means ± SD, one-way ANOVA). Blue and red circles represent individual measurements from male and female mice. Statistical analysis was conducted across genotypes. ****P < 0.0001; ns, not significant.

