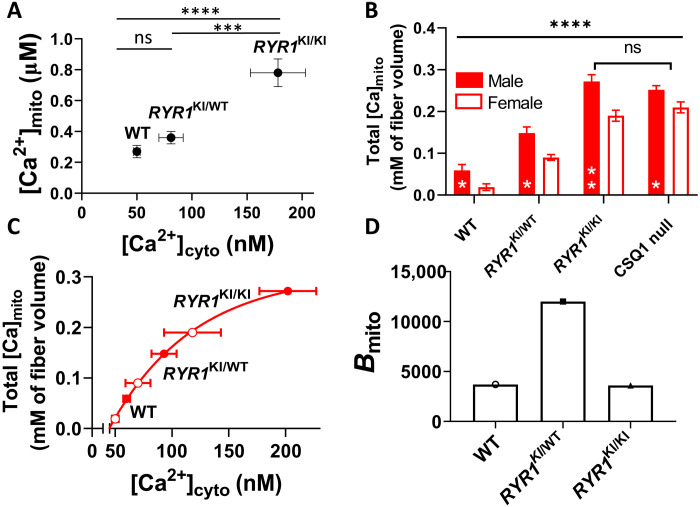
Fig. 5. Increased [Ca2+]cyto raises mitochondrial Ca2+ content.
(A) Resting [Ca2+]mito versus [Ca2+]cyto in RYR1 KI muscle. (B) Mitochondrial Ca2+ content (expressed per fiber volume) in muscle from male and female RYR1 KI mice and CSQ1 null mice. Genotypes were compared using a pooled one-way ANOVA with Tukey’s multiple comparisons (P < 0.0001). All pairwise comparisons were significantly different (****P < 0.0001) except HOM and CSQ1 (ns). Sex was compared within groups using an unpaired t test with Welch’s correction, where *P < 0.05 and **P.0.01 (bottom middle of bars). (C) Mitochondrial Ca2+ content data from B plotted against the estimated resting [Ca2+]cyto of intact fibers from female mice (see fig. S10). (D) Mitochondrial Ca2+ buffering power (Bmito = total Ca2+/free Ca2+) in RYR1 KI mouse muscle. Data in (A) are presented as means ± SEM. Data in (B) are means ± SD. Sample size: n = 7, 9, and 4 for RYR1WT/WT, RYR1KI/WT, and RYR1KI/KI, respectively; statistics: one-way ANOVA. ****P < 0.0001; ***P = 0.0002. Mean resting [Ca2+]cyto (±SD) of RYR1 KI mouse muscle measured in intact fibers [data from (5)] was used as the dependent variable for mitochondrial Ca2+ in (A) to (C). For the purpose of this study, [Ca2+]cyto of WT was normalized to 50 nM (27), and [Ca2+]cyto values for mutants proportionally shifted to the left from that in (5).

