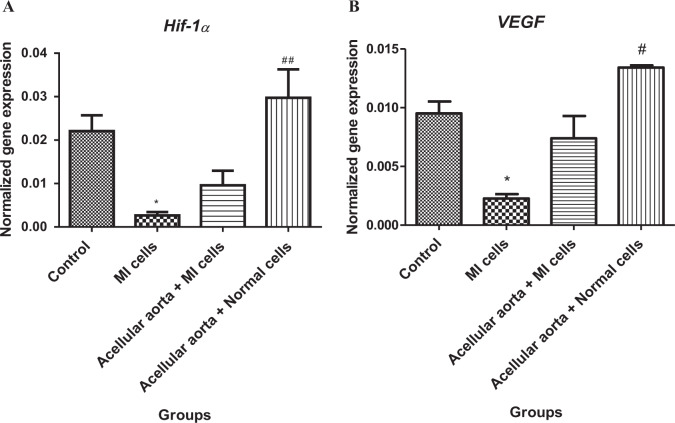
Fig. 3.
The evaluation of alterations in genes expression levels of Hif-1α (A) and VEGF (B) as antigenic factors. The quantitative data showed that the expression levels of Hif-1α and VEGF genes were severely dropped in the MI group. The acellular aorta matrix led to a remarkable increase in Hif-1α and VEGF expressions compared to the MI group. Data were statistically analyzed by one way ANOVA test, and p < 0.05 was considered significant. *Shows the significant change in comparison to control (p < 0.05). # shows the significant change in comparison to the MI group (p < 0.05). *p < 0.05, **p ≤ 0.01, and ***p ≤ 0.0001, #p < 0.05, ##p ≤ 0.01, and ###p ≤ 0.0001

