
Fig. 10.
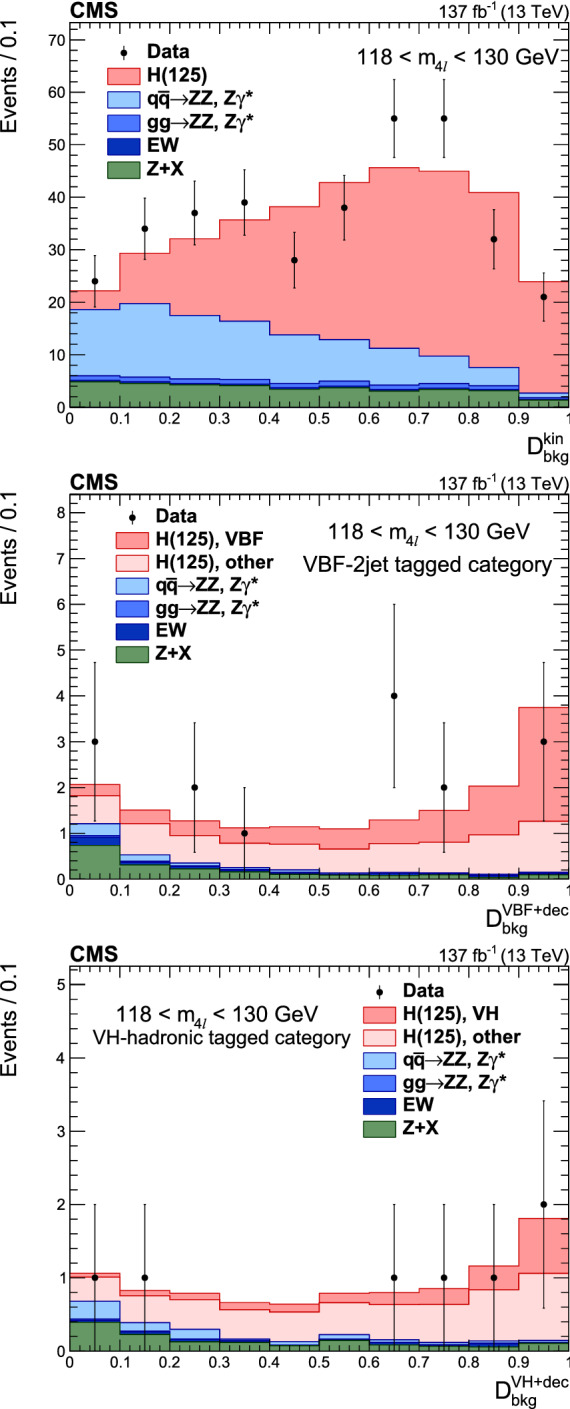
Distribution of kinematic discriminants in the mass region : (uppper) , (center) , (lower) . Points with error bars represent the data and stacked histograms represent expected distributions of the signal and background processes. The yields of the different H boson production mechanisms with , denoted as , and those of the and rare electroweak backgrounds are normalized to the SM expectations, while the +X background yield is normalized to the estimate from the data. In the center and lower figures the SM H boson signal is separated into two components: the production mode which is targeted by the specific discriminant, and other production modes, where the gluon fusion process dominates