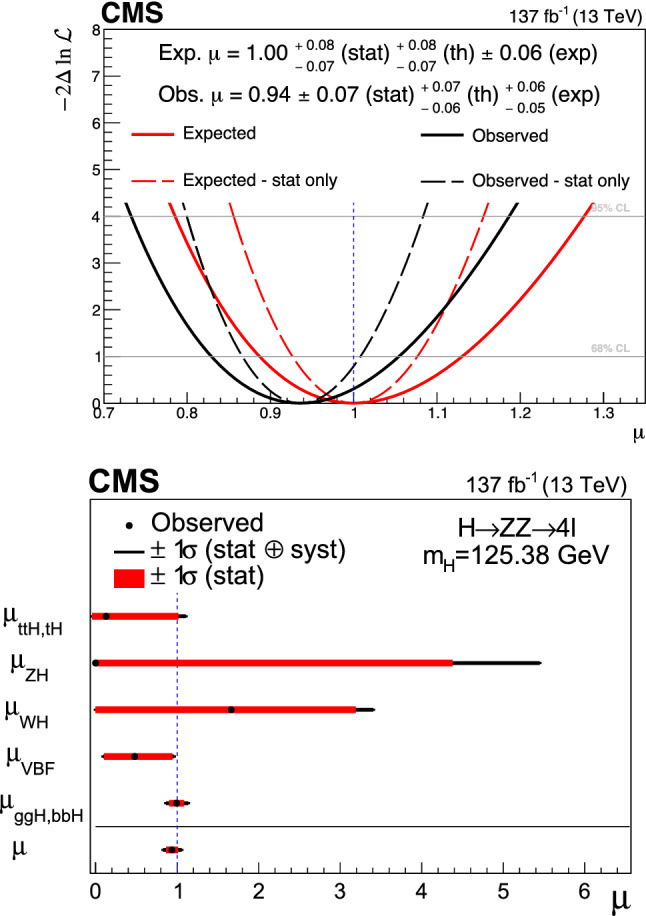
Fig. 11.

(Upper) The observed and expected profile likelihood scans of the inclusive signal strength modifier. The scans are shown both with (solid line) and without (dashed line) systematic uncertainties. (Lower) Results of likelihood scans for the signal strength modifiers corresponding to the five main SM H boson production mechanisms, compared to the SM prediction shown as a vertical dashed line. The thick black lines indicate the one standard deviation confidence intervals including both statistical and systematic sources. The thick red lines indicate the statistical uncertainties corresponding to the one standard deviation confidence intervals
