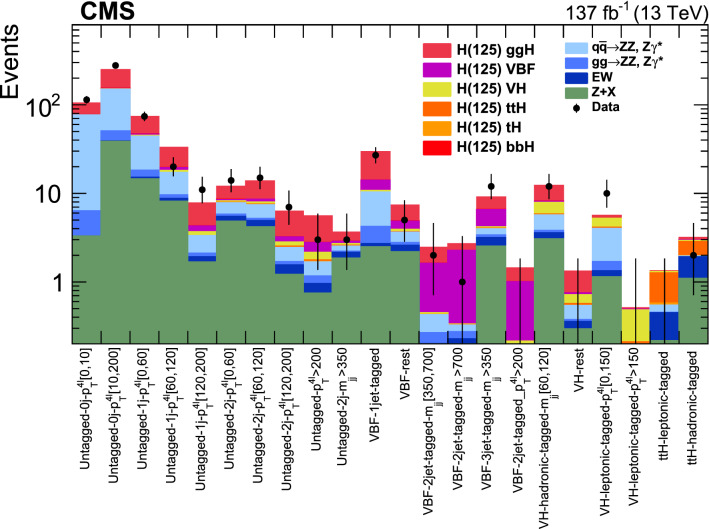
Fig. 6.
Distributions of the expected and observed number of events for the reconstructed event categories in the mass region . Points with error bars represent the data and stacked histograms represent the expected numbers of the signal and background events. The yields of the different H boson production mechanisms with , denoted as , and those of the and rare electroweak backgrounds are normalized to the SM expectations, while the +X background yield is normalized to the estimate from the data

