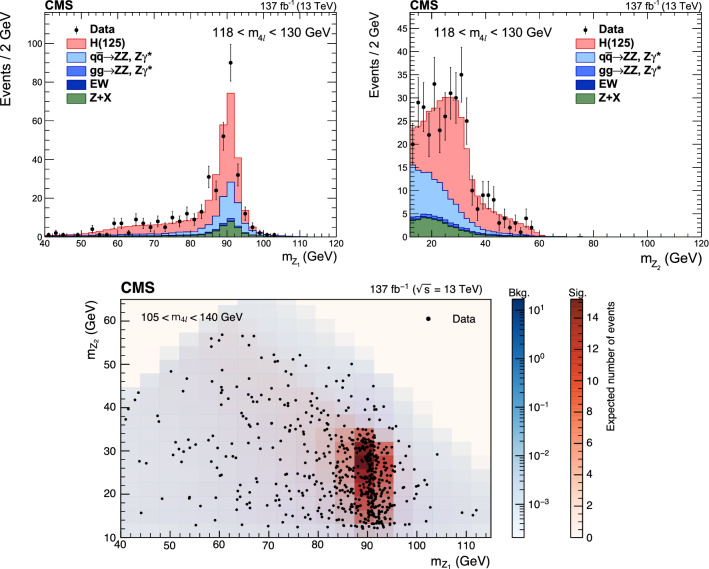
Fig. 7.
Distribution of the (upper left) and (upper right) reconstructed masses in the mass region and their 2D distribution (lower) in the mass region. The stacked histograms and the red and blue scales represent expected distributions of the signal and background processes and the points represent the data. The yields of the different H boson production mechanisms with , denoted as , and those of the and rare electroweak backgrounds are normalized to the SM expectations, while the +X background yield is normalized to the estimate from the data

