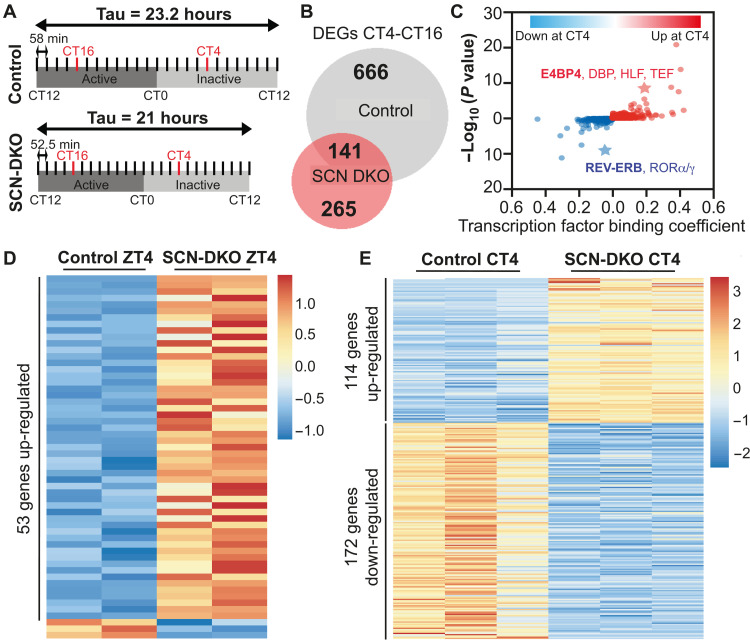
Fig. 4. SCN-specific deletion of REV-ERBs alters SCN gene transcription.
(A) Schematic representation of the harvest performed in DD and the method used to define CT4 and CT16 in control and SCN-DKO mice. (B) Venn diagram comparison of CT4-CT16 differentially expressed genes (DEGs) in SCN from control and SCN-DKO mice [transcripts per million (TPM) > 0.1, fold change (FC) > 1.5, false discovery rate (FDR) < 0.05]. Corresponding heatmap and Kyoto Encyclopedia of Genes and Genomes (KEGG) pathway analysis is presented in fig. S5 (A to D). (C) Transcription factor binding analysis (machine learning algorithm applied to promoter regions) of CT4-CT16 DEGs up- or down-regulated in control mice at CT4 and lost in SCN-DKO mice. The value of each binding coefficient indicates whether the presence of a motif is correlated with the regions of interest. (D) Heatmap of the DEGs in SCN-DKO (n = 2) mice compared to control mice (n = 2) at ZT4 (TPM > 0.1, FC > 1.5, FDR < 0.05). Three to four independent SCN punches were pooled together per biological replicate. Corresponding KEGG pathway analysis is presented in fig. S5E. (E) Heatmap of the DEGs in SCN-DKO (n = 3) mice compared to control mice (n = 3) at CT4 (TPM > 0.1, FC > 1.5, FDR < 0.05). Three to four independent SCN punches were pooled together per biological replicate. Corresponding KEGG pathway analysis is presented in fig. S5F.

