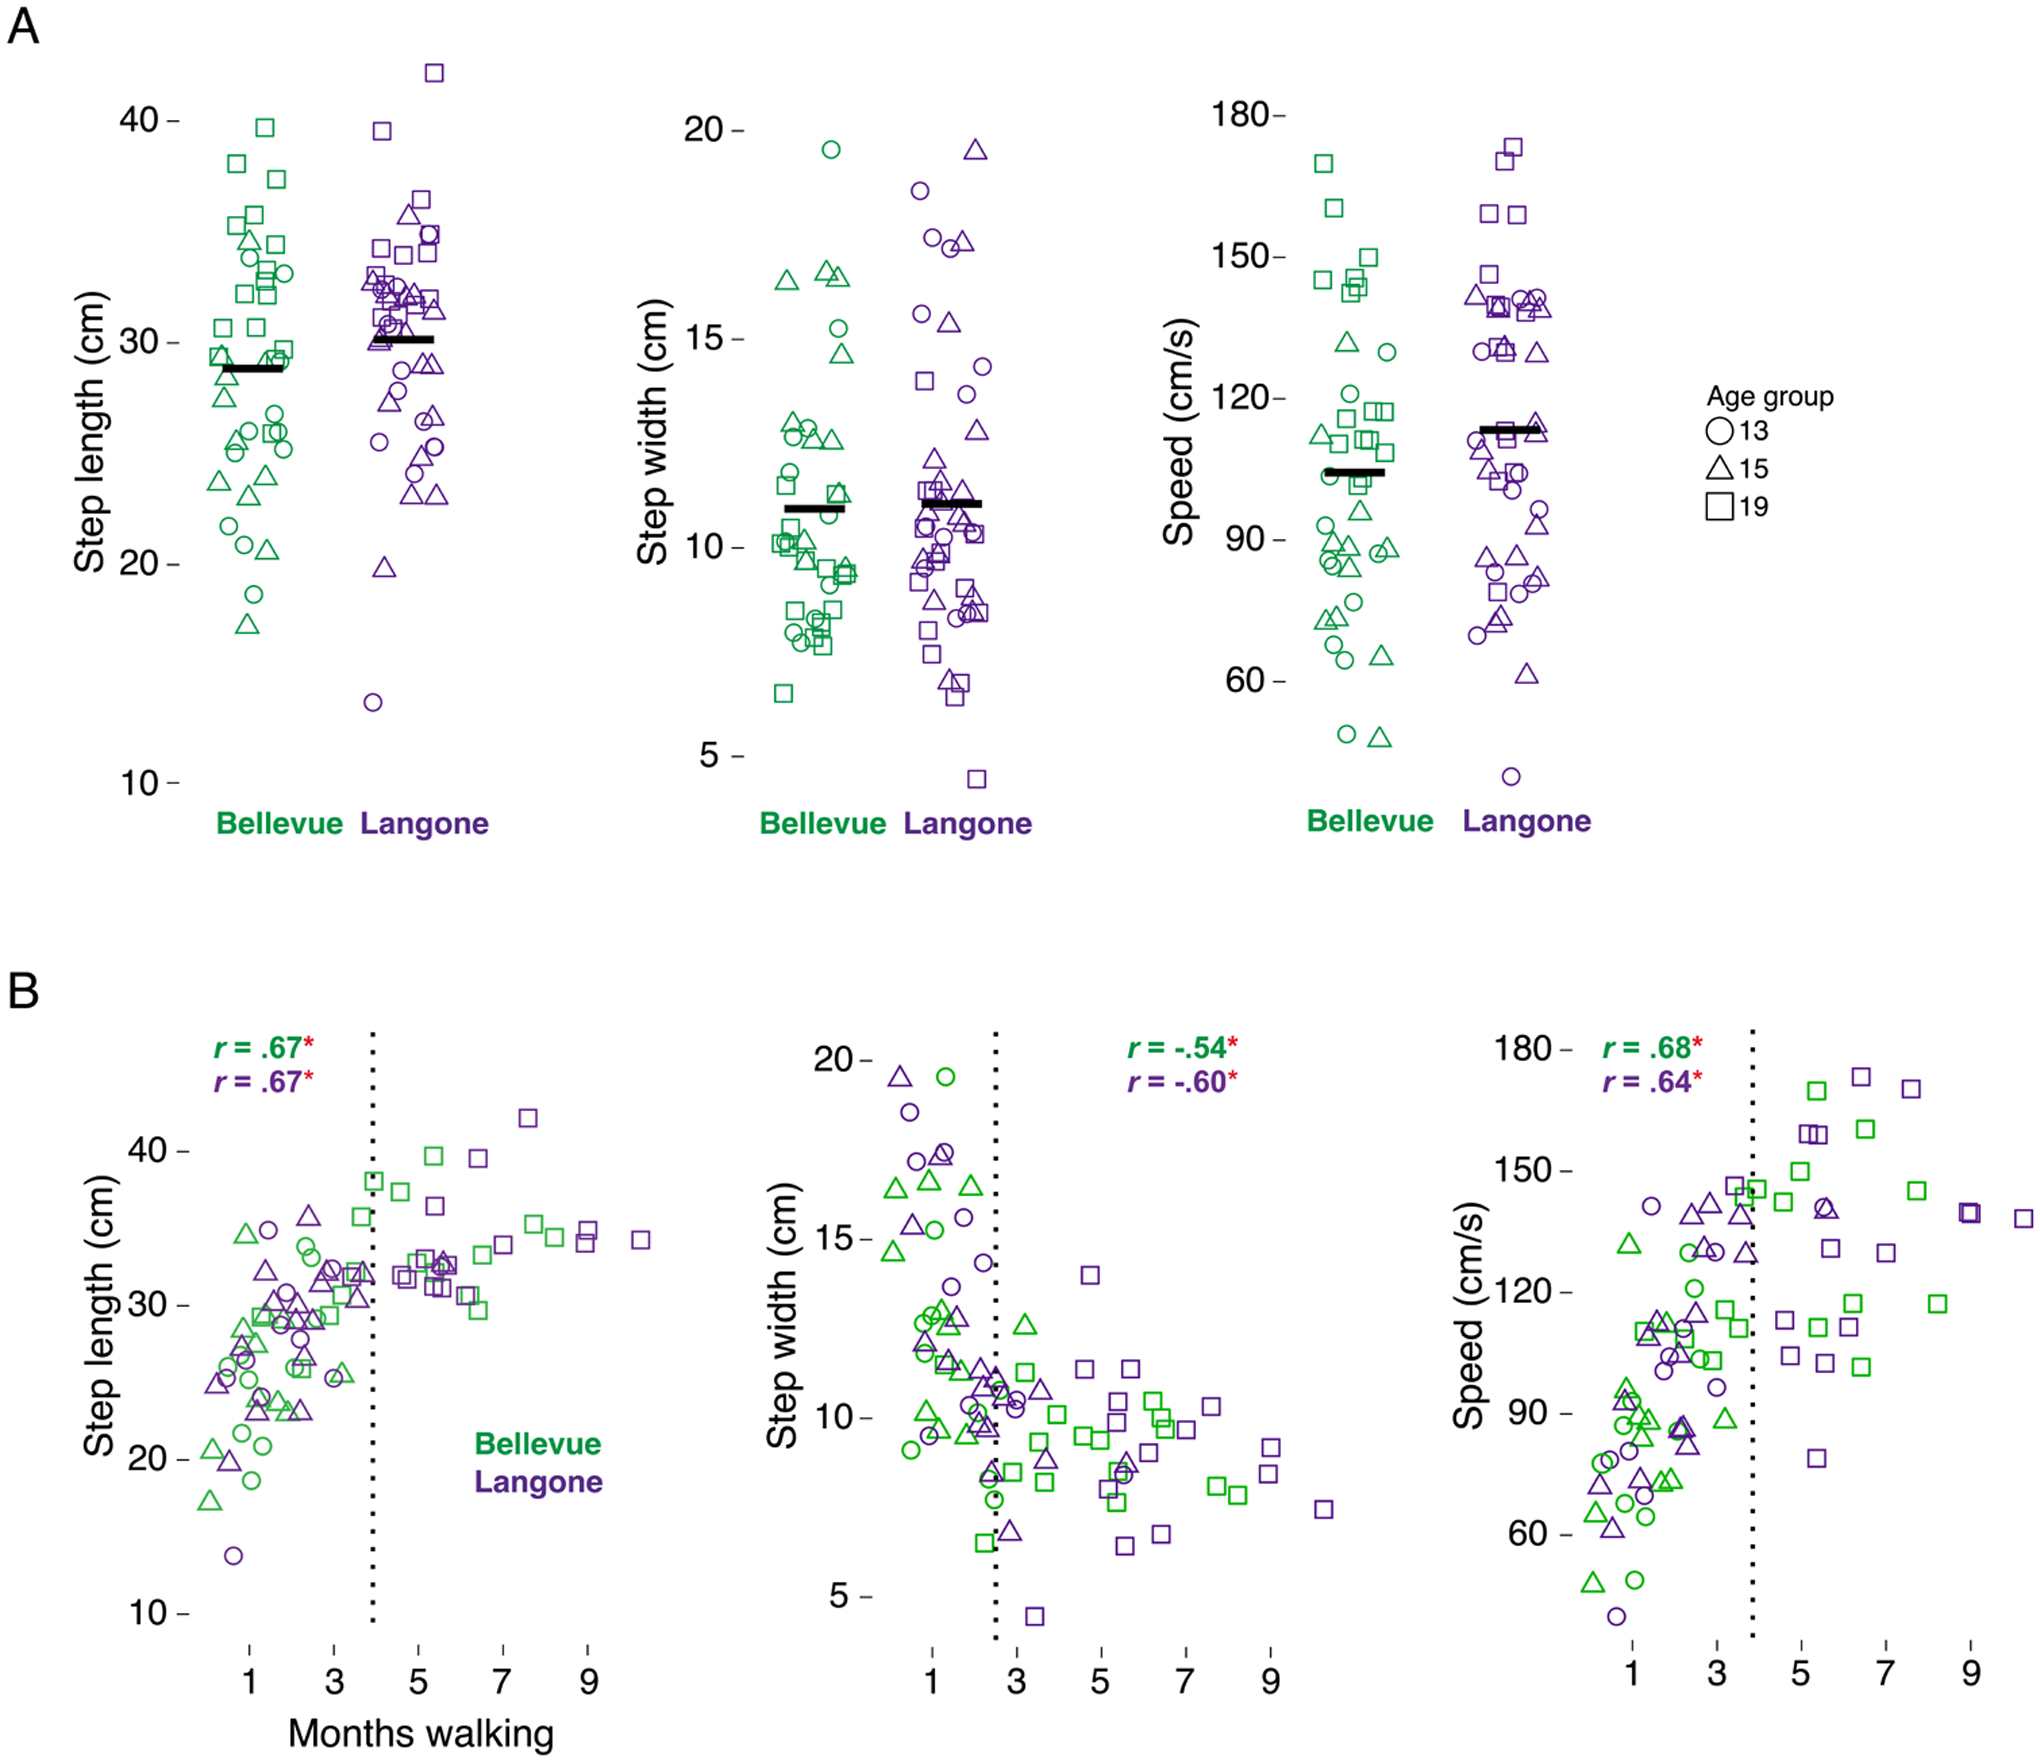
Figure 3.

Walking skill for Bellevue (green) and Langone (purple) samples. Each symbol represents averaged data for one infant. (A) Step length, step width, and speed for each sample. Horizontal bars denote group averages. (B) Step length, step width, and speed for each sample as a function of months walking. Correlation coefficients reflect rates of improvement for each sample. Clustering of circle and triangle symbols at early months and squares at later months reflects expected differences in months walking by infant test age. Vertical dotted lines denote the inflection point between faster rates of improvement in earlier months of walking and slower rates at later months estimated by nonlinear regression analyses: 3.9 months for step length, 2.5 months for step width, and 3.6 months for speed.
