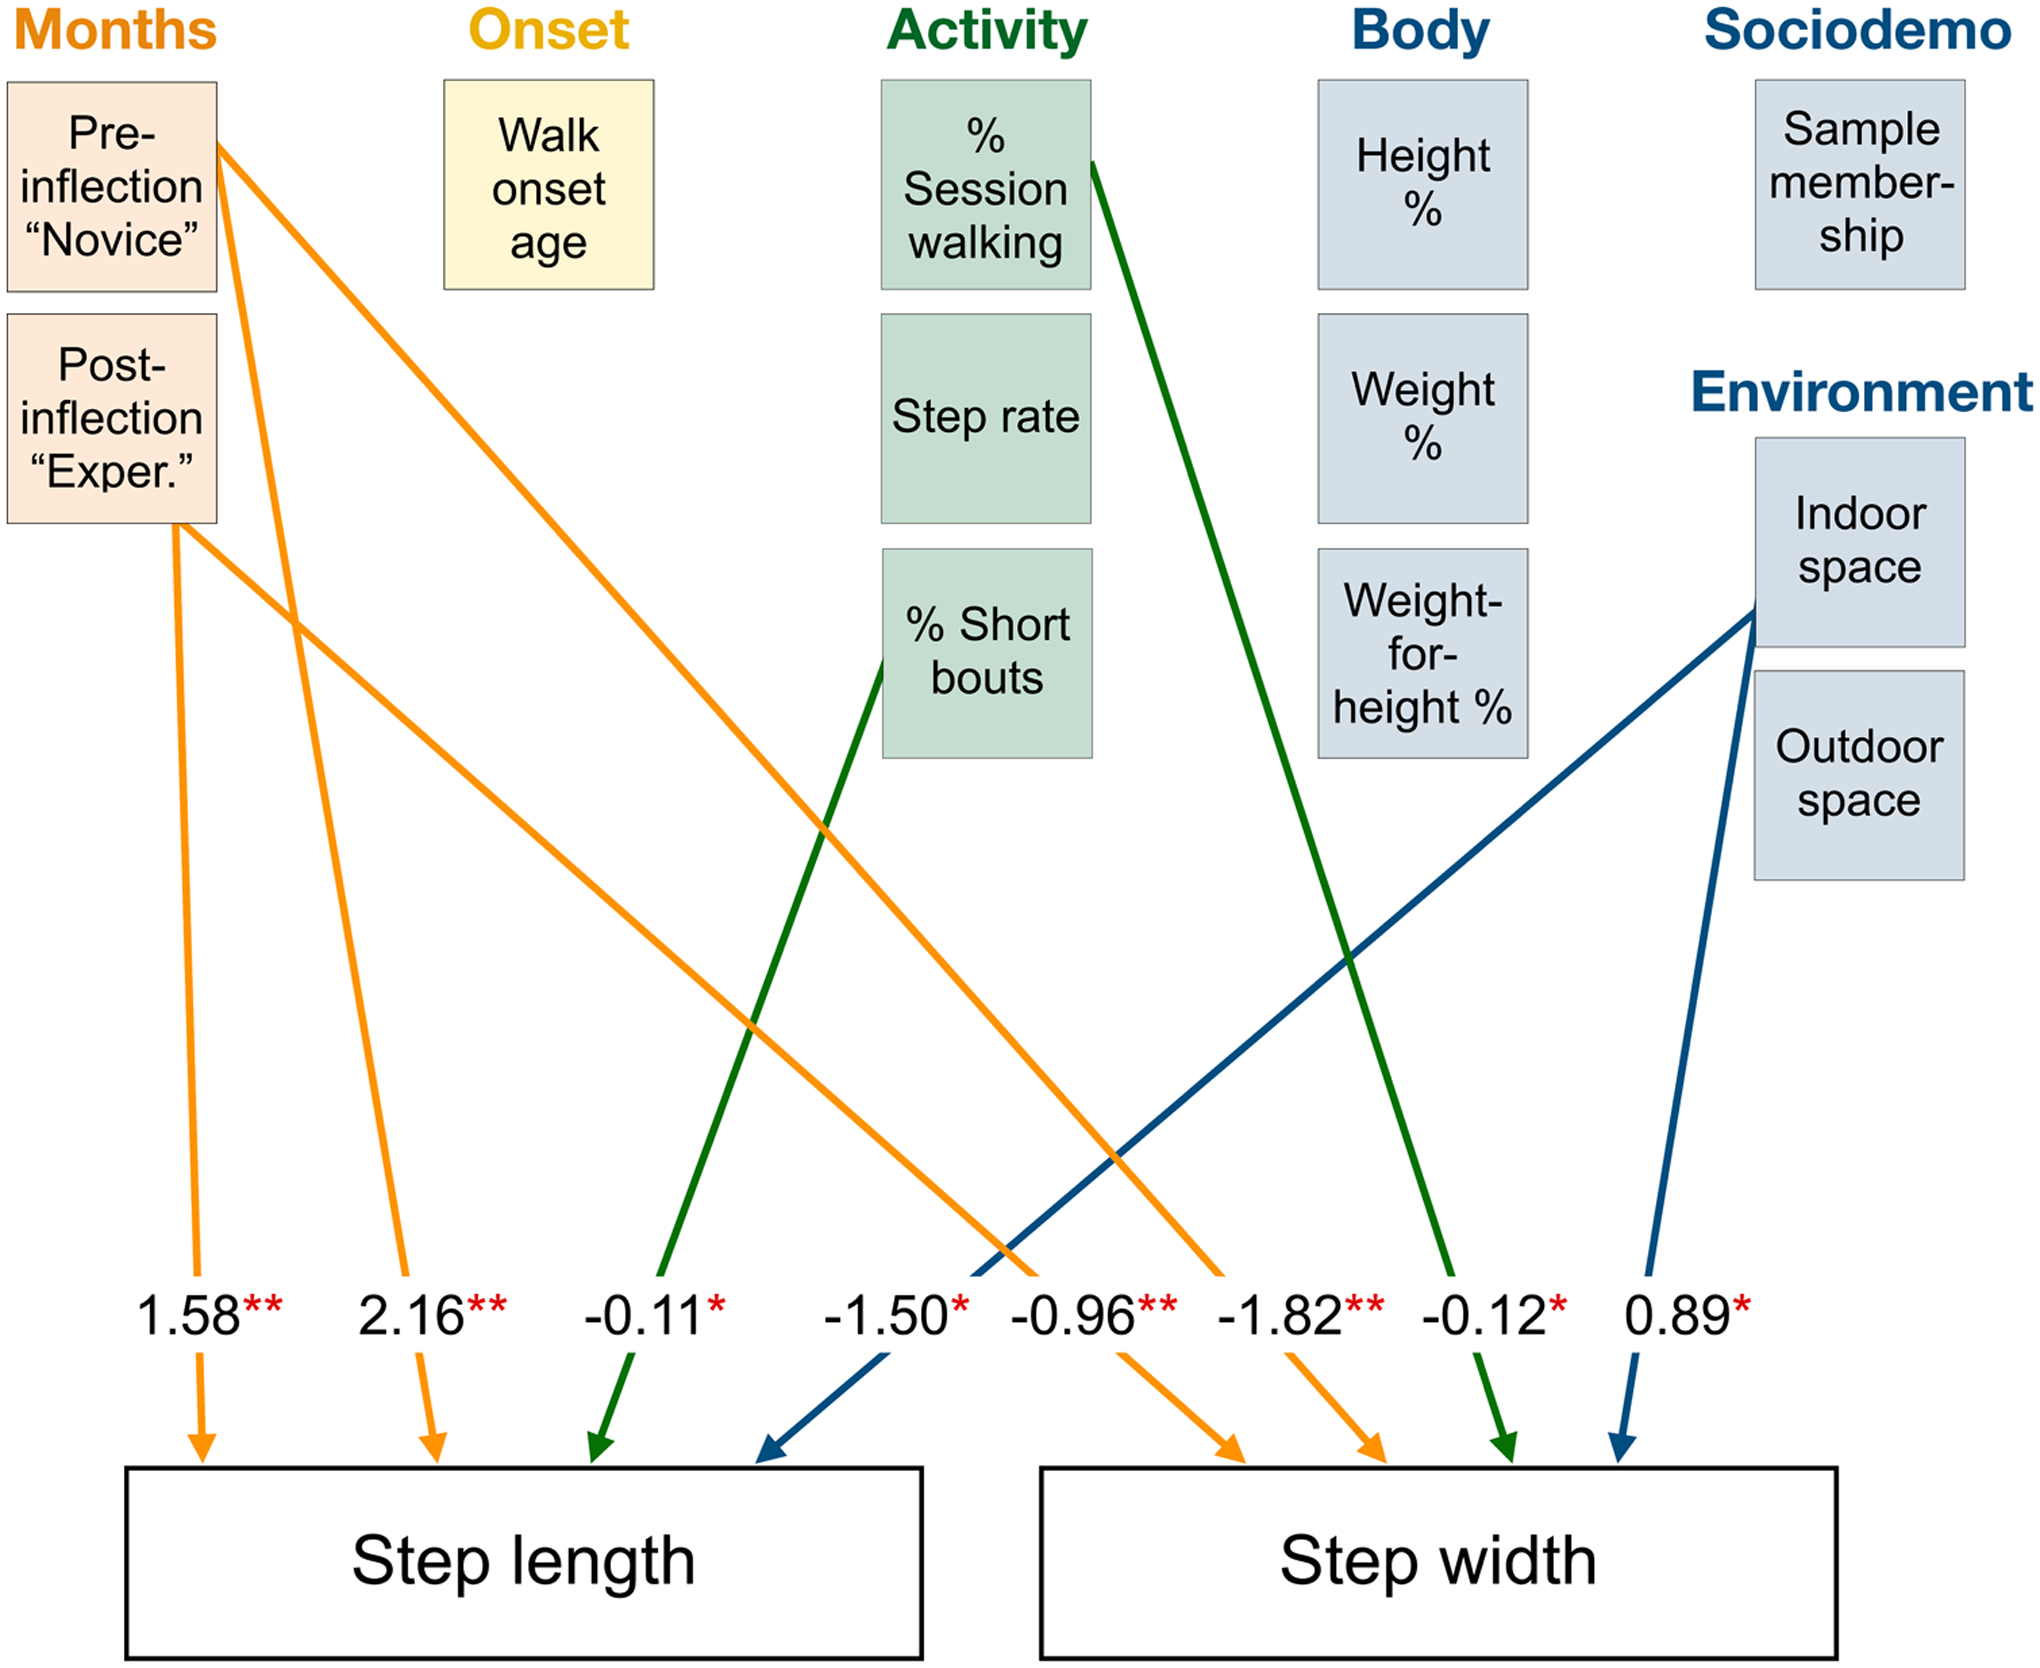
Figure 7.

Regression model for walking skill. Variables in each box along the top and right side of figure were entered as predictors for both outcome measures (step length and step width). Box and line colors reflect sets of conceptually related predictors. The measure “months walking” was split into two predictors based on the identified inflection points (less than and more than 3.9 months for step length, less than and more than 2.5 months for step width). Data for each measure of months walking were entered as separate variables to estimate effects of months walking before and after the inflection points. Significant predictors are denoted with arrows to outcome measures. Significant beta coefficients are denoted above each outcome measure (**p < .01, *p <.05). Larger beta coefficients reflect stronger predictive power, while statistically adjusting for other measures. Beta coefficients should be interpreted as the change in cm of step length or step width for each “1-unit” change in the predictor (e.g., an additional month of walking pre-inflection is associated with a 2.16-cm increase in step length; an additional person per room is associated with a 0.89-cm decrease in step width).
