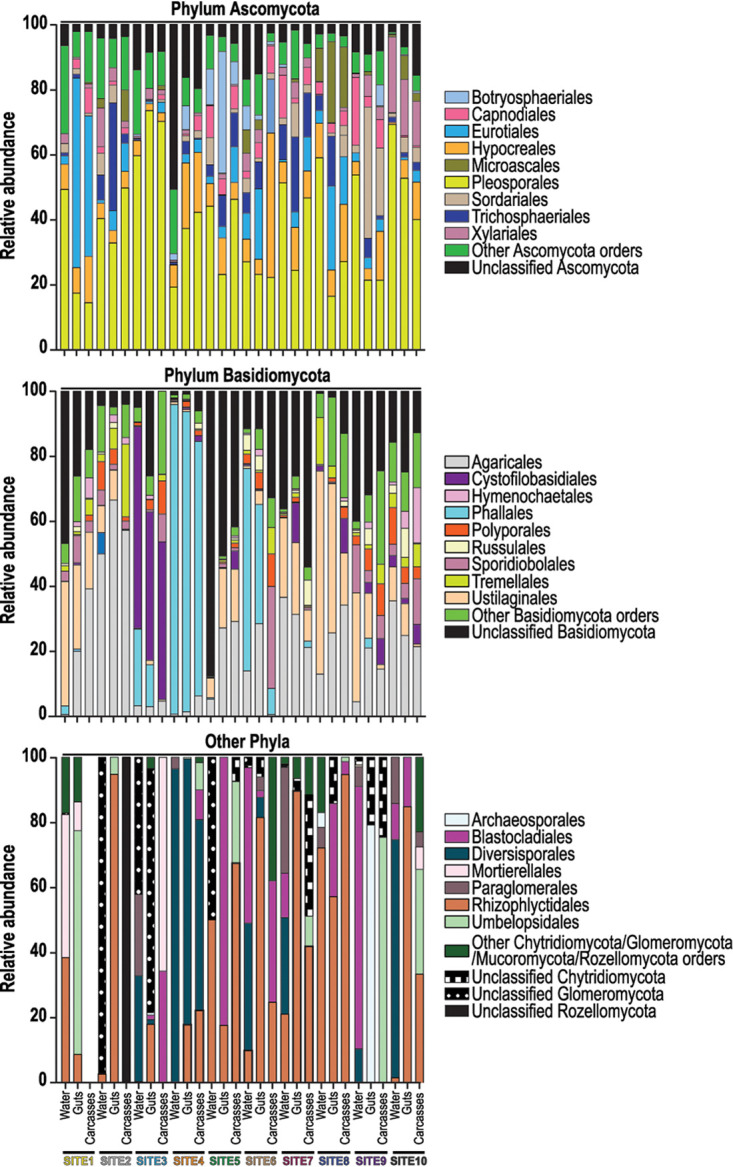
FIG 2.

Fungi at the levels of phylum and order in water and mosquito larvae from each collection site. Gut and carcass samples from individual larvae collected from a given site were pooled for the bar graphs presented. For a given phylum, bars present the proportion of sequencing reads assigned to that phylum that were also classified to a specific fungal order. All orders that represented ≥10% of the reads from a given sample are listed in the key; less abundant orders are grouped under the “Other” categories.
