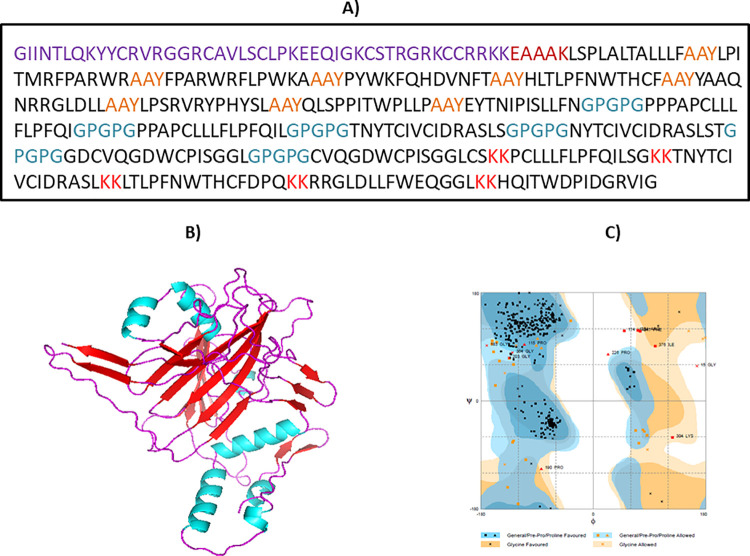
Fig 5.
(A) MEBV construct sequence. Black letters represents the epitopes sequences. Purple letters depict adjuvant sequence, Maroon color shows EAAAK linker, Blue color displays GPGPG linkers and red color demonstrates the KK linkers; (B) Pipes representation of refined 3D model of final MEBV construct (cyan color shows ɑ-helix, red color depicts β-strands and magenta color illustrates random loops); (C) Ramachandran plot analysis of estimated MEBV model, showing the presence of 89.2% residues in the favored region.

