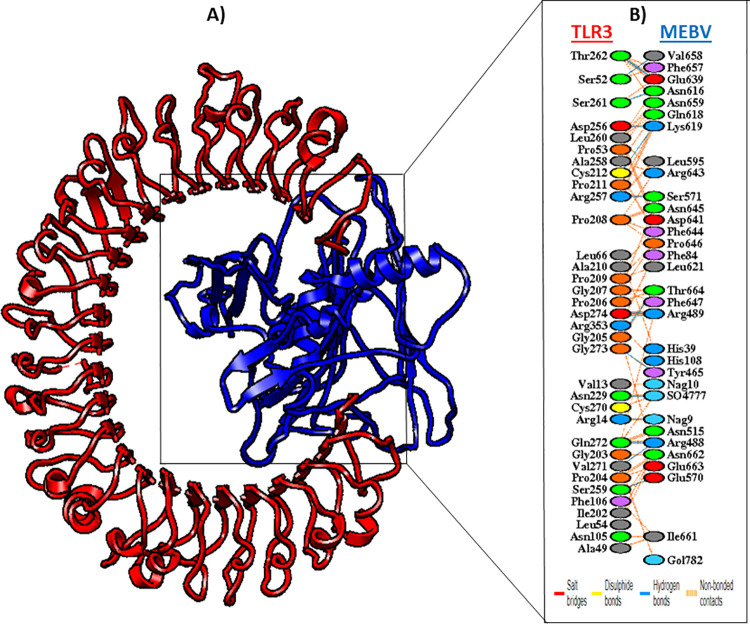
Fig 8. TLR3-MEBV docked complex shown at the left in cartoon representation.
Interacting residues of MEBV are highlighted at right side. MEBV construct revealed with blue color and TLR3 displayed with red color. Red lines represent salt bridges, blue lines show Hydrogen bonds, whilst orange lines demonstrate the other contacts in docked complex. The colors of interacting residues are interpreting the characteristics of amino acids (neutral: green, Cys: yellow, aromatic: pink, aliphatic: grey, positive: blue, negative: red, and Pro&Gly: orange).

