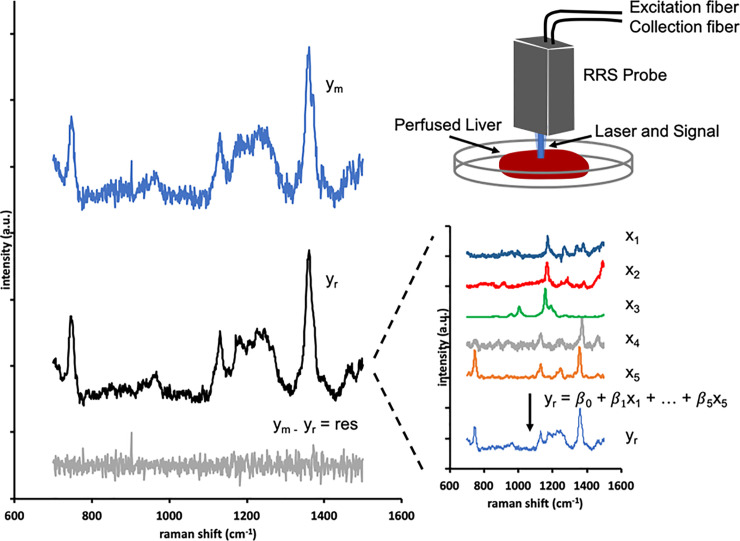
Fig 1. Spectra library and processing algorithm.
The excitation light is focused on a 1.5 mm diameter spot on the liver tissue, and the scattered light is collected by the probe optics and coupled to the collection fiber. In the spectrometer, the light is passed through a grating onto a CCD which is read each second to produce a raw spectrum. The fluorescence background is subtracted, leaving the measured spectrum (ym) for regression. The regression algorithm finds the best fit (yr) as the scaled addition of the library chromophore spectra (x1 … xn) in order to minimize the unexplained residual spectrum (ym−yr). For perfused rat livers, the regression library included liver bile (x1), perfusate (x2), beta carotene (x3), oxidized mitochondria (x4), and reduced mitochondria (x5).

