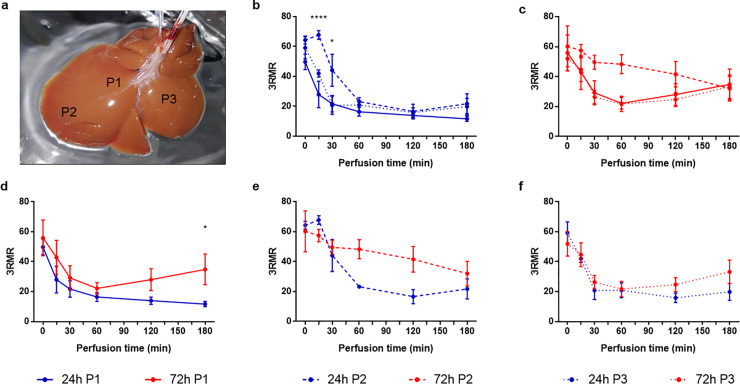
Fig 3. Spatial differences in the response of mitochondrial redox to ischemia reperfusion.
a) Photo of a rat liver showing the position where the 3RMR was measured. Position 1 (P1, continuous lines) was measured on the middle of the left lateral lobe, P2 (dashed lines) distal on the left lateral lobe, and P3 (dotted lines) on the middle of the right medial lobe. b) Differences in the 3RMR during machine perfusion in 24-h-CI livers (blue lines). c) Differences in the 3RMR during machine perfusion in 72-h-CI livers (red lines). d) Difference between the 3RMR at P1 between 24-h-CI and 72-h-CI liver. e) Difference between the 3RMR at P2 between 24-h-CI and 72-h-CI liver. f) Difference between the 3RMR at P3 between 24-h-CI and 72-h-CI liver. Stars denote statistical significance (two-way repeated measures ANOVA, followed the Sidak’s post-hoc test): *0.01 < p < 0.05; **0.001 < p < 0.01; ***0.0001 < p < 0.001; ****p < 0.0001. Dots: Means. Error bars: SEM.

