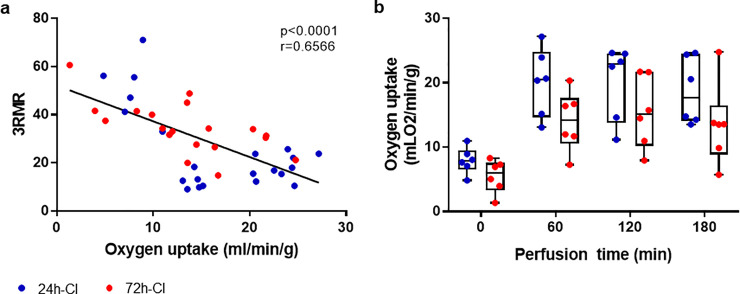
Fig 4. Mitochondrial redox state and oxygen uptake.
a) Scatterplot of the 3RMR versus the oxygen uptake rate of 24-h-CI (blue) and 72-h-CI (red) livers. Black lines: Fit of linear regression with 1, 39 degrees of freedom (DFn, DFd). r: Pearson’s correlation coefficient. b) Boxplots of the oxygen uptake rate of the livers during machine perfusion. Boxes: Median with interquartile range. Whiskers: Min max.

