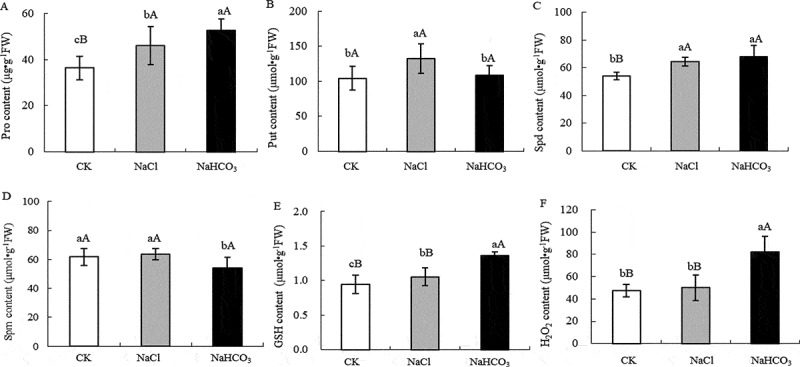
Figure 3.

Pro content (a), Put content (b), Spd content (c), Spm content (d),GSH content (e) and H2O2 content (f) of mulberry leaves under NaCl and NaHCO3 stress. Note: The data are from three replicated experiments (n = 3), and represent means ± SE. Significant differences were expressed by different small letters (P < .05), and very significant differences were expressed by different capital letters (P < .01).
