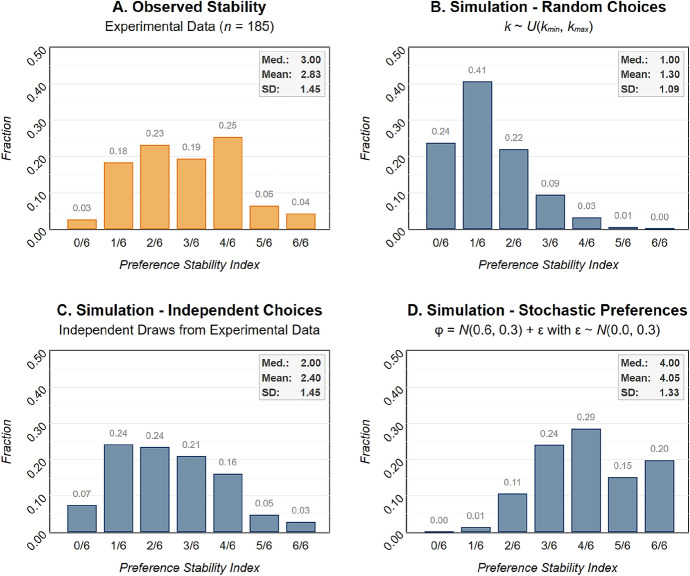
Fig. 1.
a Distribution of the preference stability index (number of pairwise comparisons in which implied parameter intervals overlap) for the experimental data (). b Simulation exercise with virtual subjects choosing uniformly and independently from the available choices in each of the four risk preference elicitation methods. c Simulation exercise with virtual subjects choosing independently from the choice distribution of each task observed in the experiment. d Simulation exercise with virtual subjects with stochastic preferences, where a noise term is added directly to subjects’ crra parameter . for each simulation

