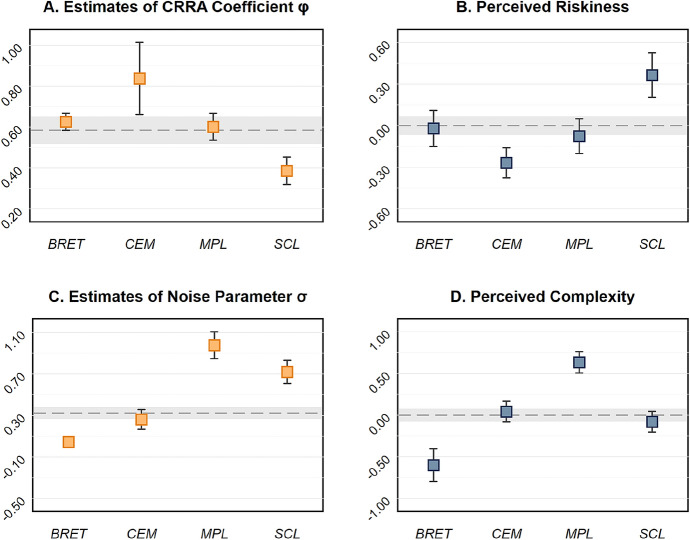
Fig. 2.
a Maximum likelihood estimates of crra coefficients . b Average perceived riskiness (subject-demeaned data) for the four risk preference elicitation methods. c Maximum likelihood estimates of the standard deviation of the structural noise parameter . d Average perceived complexity (subject-demeaned data) for the four risk preference elicitation methods. In all panels, error bars indicate 95% confidence intervals. The dashed lines indicate the overall estimate (pooling all tasks) in Panels a and c ( and ), and depict means in Panels b and d; shaded areas indicate 95% confidence intervals. Standard errors in the maximum likelihood estimations are clustered on the individual level; . bret, cem, mpl, and scl denote the “bomb” risk elicitation task, the certainty equivalent method, the multiple price list, and the single choice list, respectively

