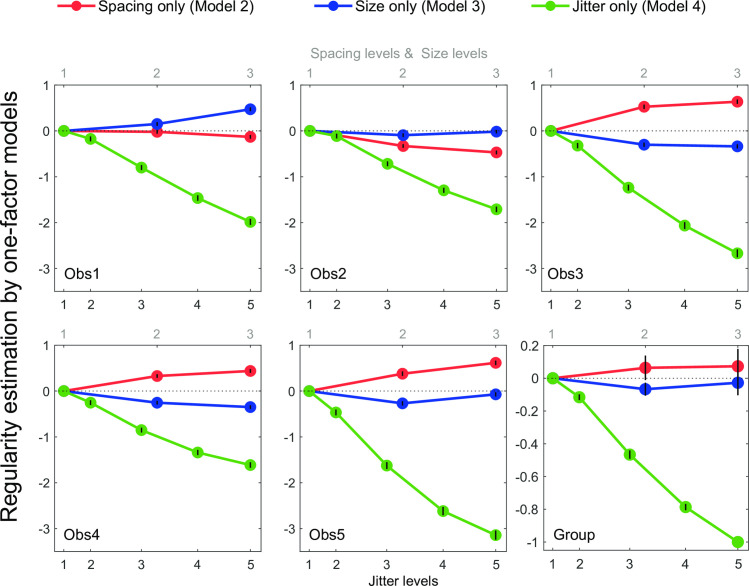
Fig 4. Parameter estimates of the one-factor statistical models for each observer and their normalized group mean.
The estimated values are plotted as a function of element spacing level (red lines), element size level (blue lines), and jitter level (green lines). The three element spacing and element size levels correspond to the top scale in the abscissa, while the five jitter levels are indicated by the bottom scale in the abscissa, which correspond to the proportion of the averaged Pythagorean distance of the resulting element positions (see S7 Fig). For the individual graphs (Obs 1–5) the error bars represent standard errors of the parameter estimation from second partial derivatives of the log likelihood at the minimum [17]. For the group graph, the original parameters were normalized to the maximum absolute value, which is condition Rγ5, for each observer, then averaged across observers. The error bars represent standard errors of the normalized parameters calculated across the five observers. No error bars for conditions Rα1, Rβ1 and Rγ1 as they were set to 0 at each individual’s level. Also no error bar is shown for condition Rγ5 in group plot as it was set to -1 for normalization.

