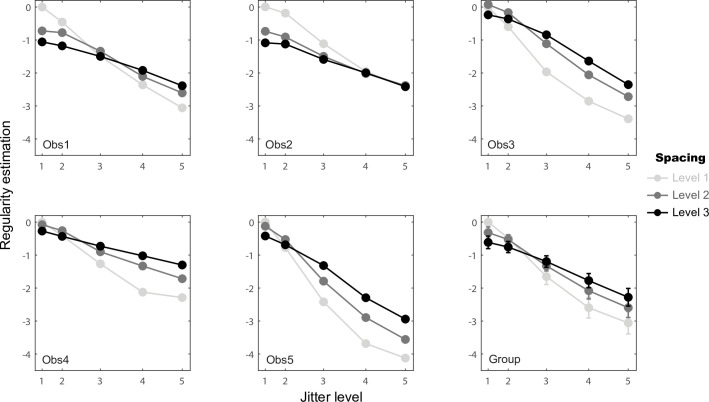
Fig 5. Element spacing × jitter interaction based on the coefficients of statistical Model 8.
Estimated regularity values are plotted against jitter level (corresponding to the proportion of the averaged Pythagorean distance of the resulting element positions as in Fig 4) for the three element spacing levels separately (light to dark lines). Group data were calculated by pooling the individual data values together across the five observers and calculating their means and standard errors for each condition.

