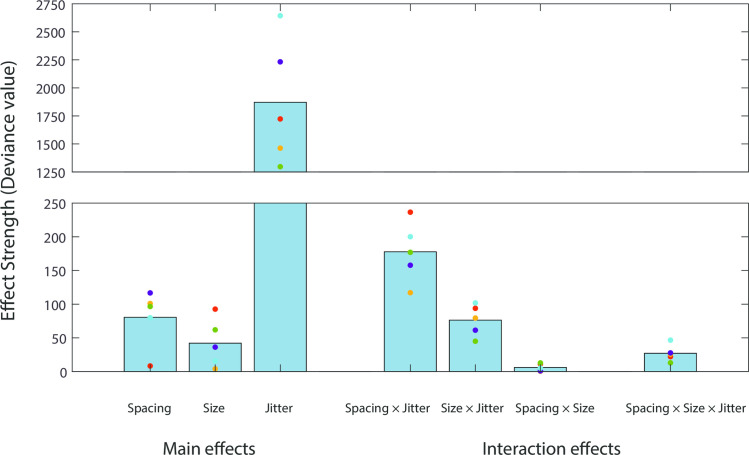
Fig 7. Summary of the three-way MLCM statistical model comparisons.
The bars (from left to right) represent the mean effect strength (deviance) across the five observers for element spacing, size and jitter main effects (S1 Table) and element spacing × jitter, element size × jitter, element spacing × size (S2 Table) and three-way interactions (S3 Table). Colored circles represent individual data of five observers. The bar chart is depicted with a break between deviance values 250 and 1250, to improve visualization of small values.

