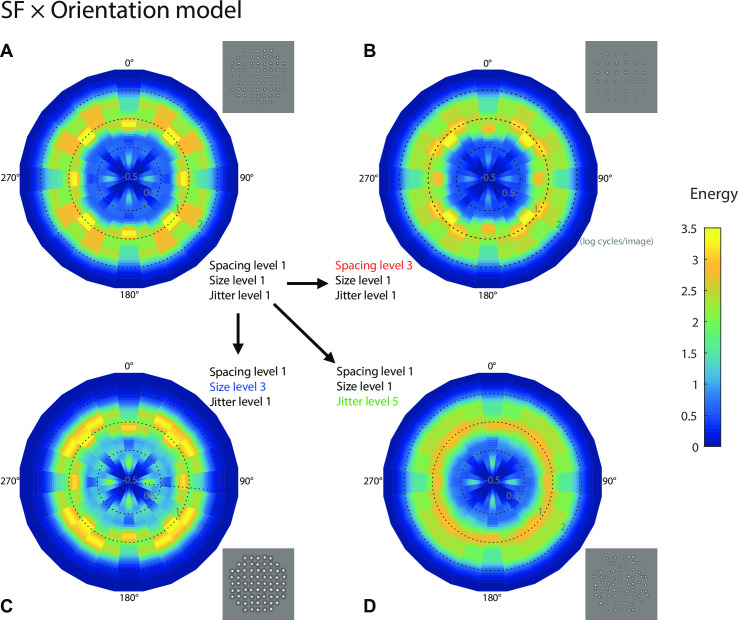
Fig 9. Gabor wavelet analysis results for the SF × orientation distribution model.
The same SF analysis as in Fig 8 was performed, except the SF distributions were analyzed separately for each of the 12 orientations, and then the standard deviations of the distribution parameters across orientations were calculated [16]. The SF distributions are represented as polar image plots of energy (RMS responses) as a joint function of spatial frequency (distance from center, as scaled by circular dotted lines for three SF levels 0.5, 1 and 2 log cycles/image) and orientation (polar angle) for four selected experimental conditions. In (A) we show a standard reference condition for element spacing, size and jitter all at level 1, which can be compared to element spacing change (B), element size change (C) and jitter change (D). The results show that jitter spreads out the energy across orientations much more than spacing or size.

