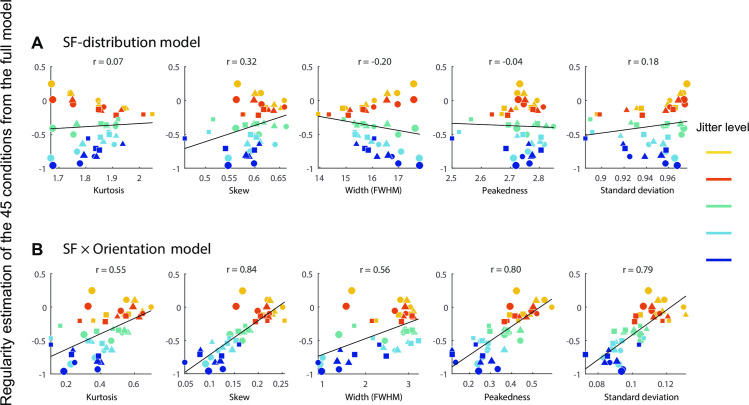
Fig 10. Comparison of SF-distribution model and SF × orientation distribution model in predicting psychophysical results.
Perceived regularity estimates for the 45 experimental conditions from the full statistical Model 12 (see S3 Fig) are correlated with five SF-distribution parameters (kurtosis, skew, FWHM, peakedness and standard deviation) from SF-distribution model (A) and another five parameters from SF × orientation distribution model (B). Color codes for the five jitter levels (yellow to blue). The marker size (small to large) corresponds to element size (level 1 to 3), and the marker shape (circle, triangle and square) corresponds to element spacing (level 1 to 3). The SF × orientation distribution model shows stronger correlations with perceived regularity, across all of the five parameters.

