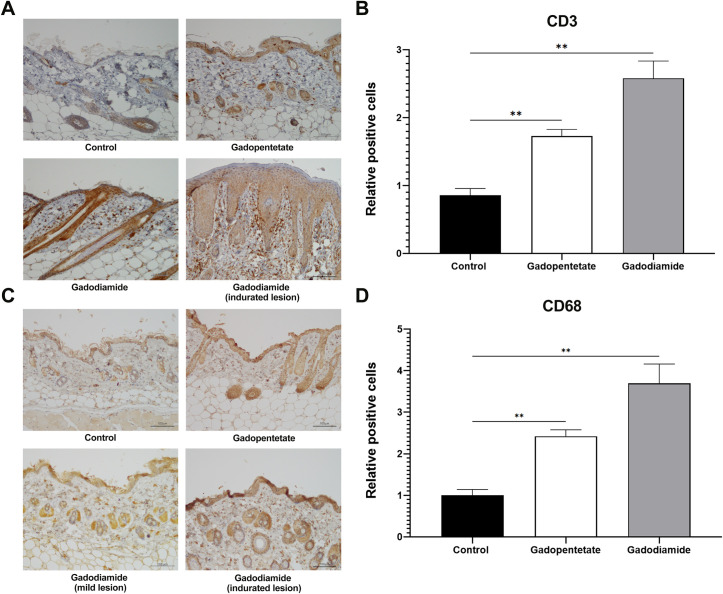
Fig 3. Effect of GBCAs injection on the CD3 and CD68 expression on the skin.
Representative photomicrographs of CD3+ T cells (A) and CD68+ macrophage immunostaining (C). Quantification number of infiltrated CD3+ T cells (B) and CD68+ macrophages (D) in the dermis, determined by counting cells in six random microscopic fields. The expression of CD3+ cells was significantly higher in the gadodiamide group compared to the control group, in mice with mild lesions and mice with severe lesions. Similar results were also observed in the CD68+ expressed cells. Scale bar = 100 μm. The expression of positive cells in control mice was assigned values of 1. All data represent the mean score ± SEM. **p < 0.01.

