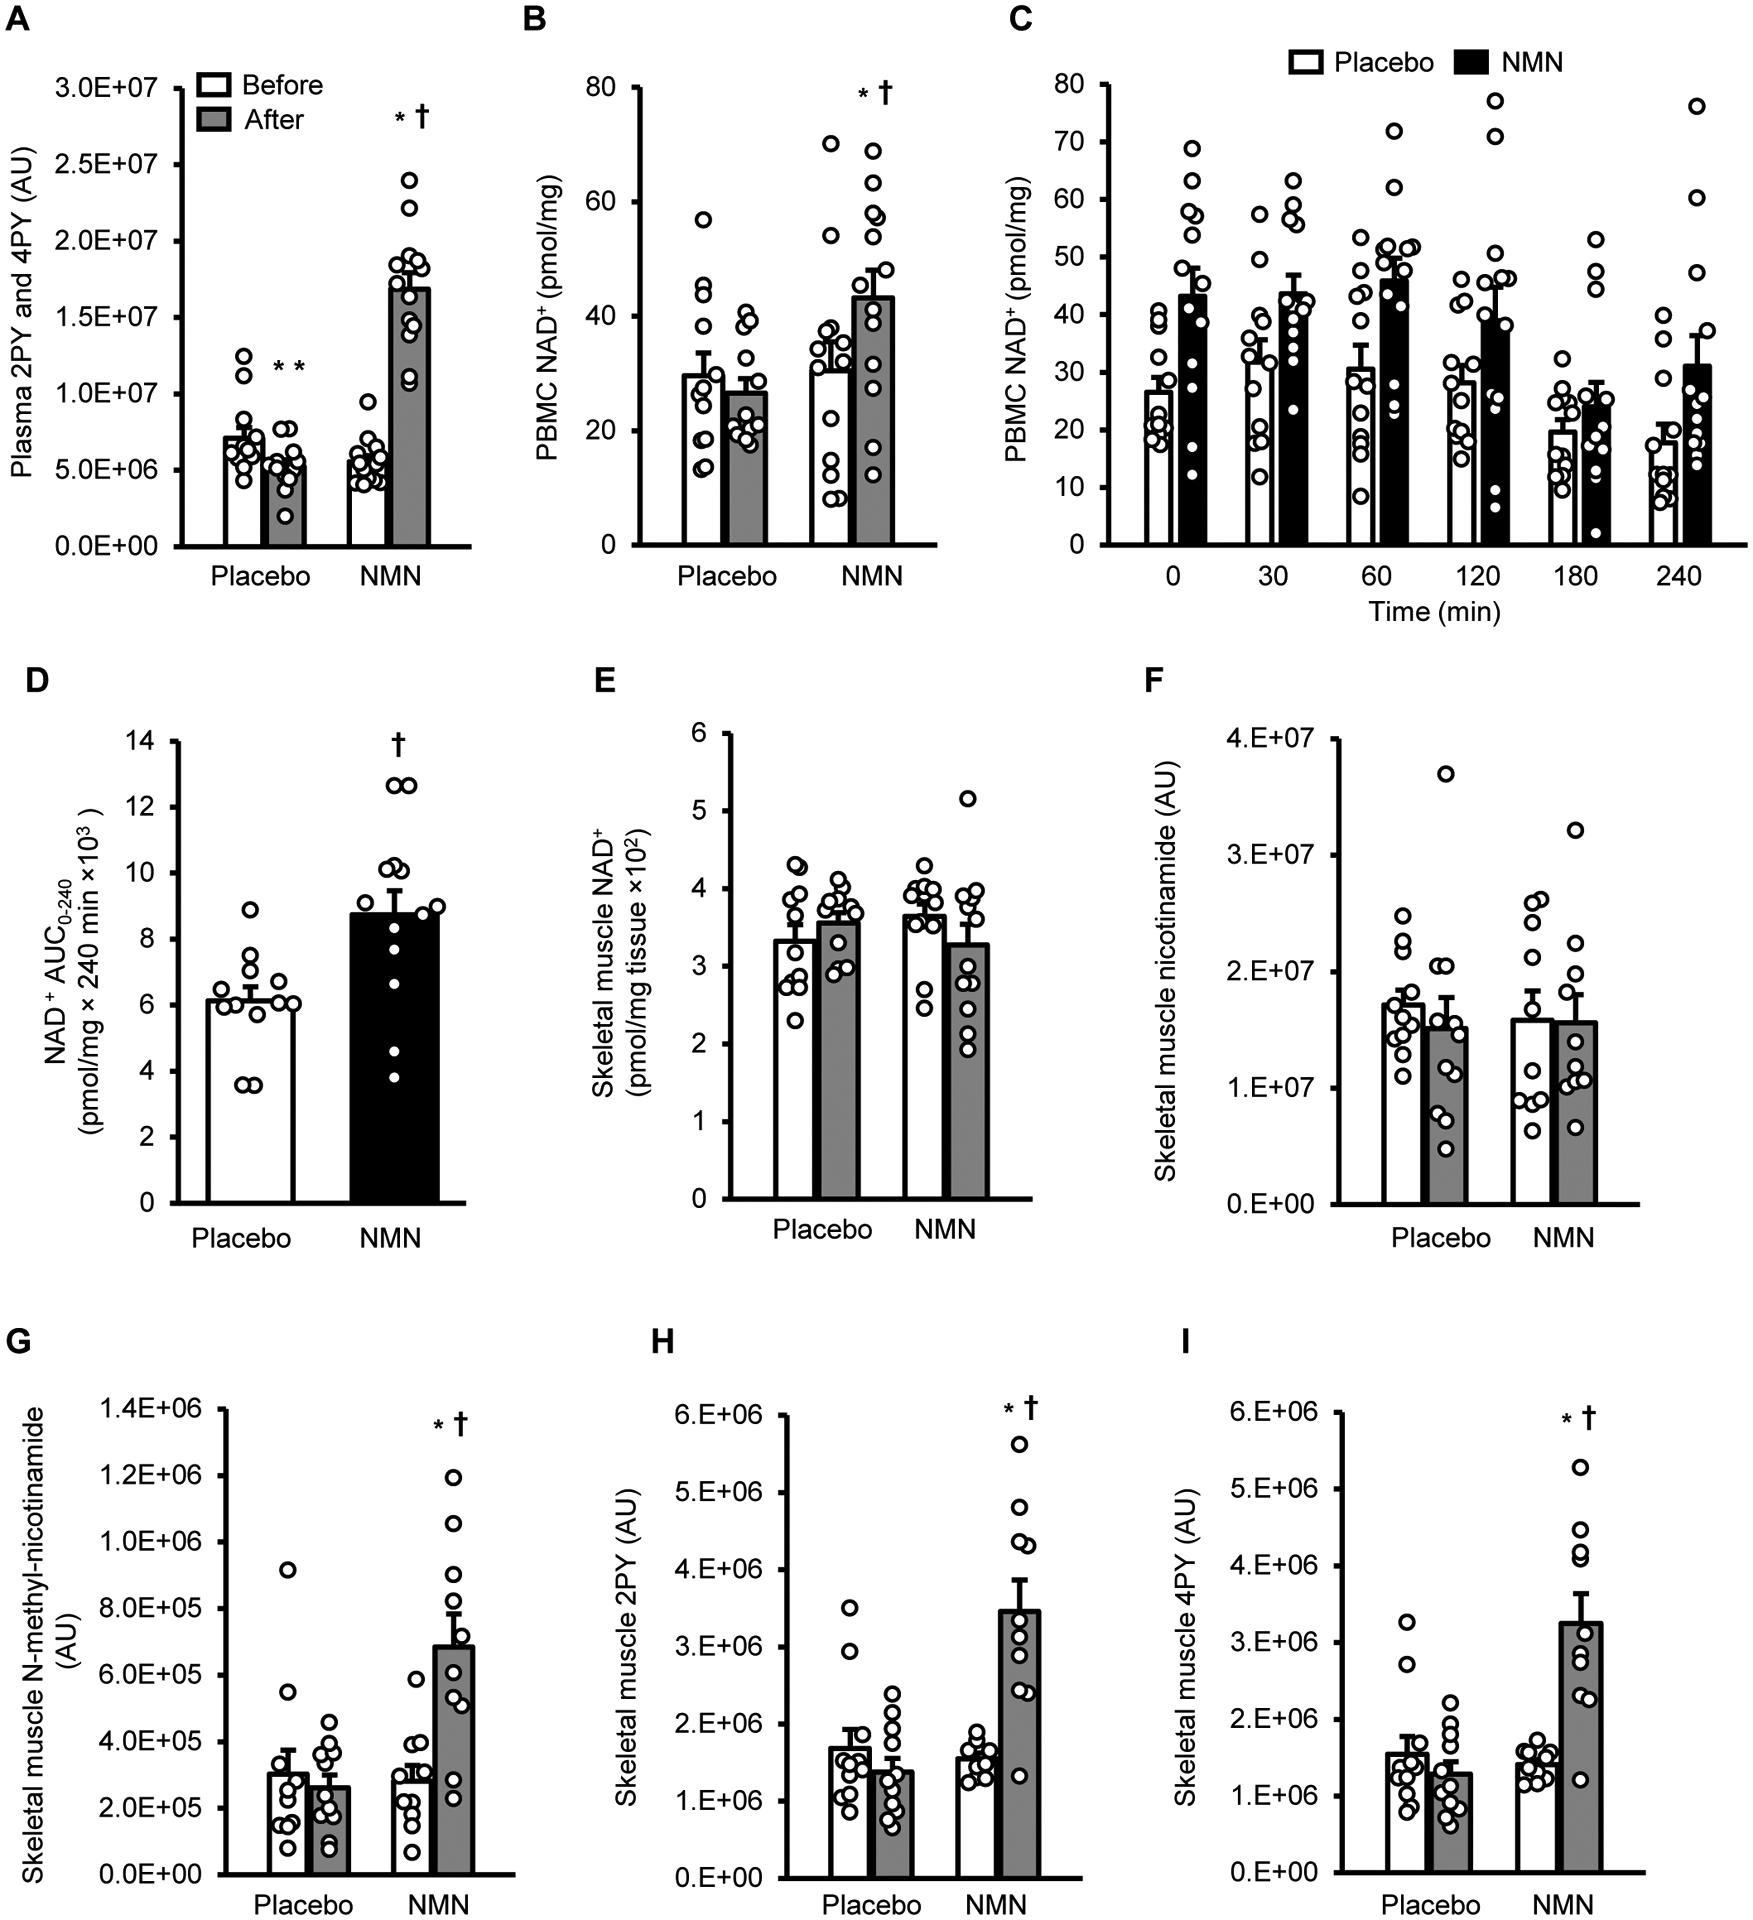
Figure 1. NMN metabolites and NAD+ in plasma, PBMCs, and skeletal muscle.

A, Plasma N-methyl-2-pyridone-5-carboxamide (2PY) and N-methyl-4-pyridone-5-carboxamide (4PY) before (white bars) and after (gray bars) treatment. B, Basal peripheral blood mononuclear cell (PBMC) NAD+ content before (white bars) and after (gray bars) treatment. C, PBMC NAD+ content before (Time 0) and for 240 minutes after ingesting a placebo capsule (white bars) or NMN (250 mg) (black bars) at the end of 10 weeks of treatment with placebo or NMN. D, PBMC NAD+ area under the curve (AUC) for 240 minutes after ingesting a placebo capsule or 250 mg of NMN. E to I, skeletal muscle NAD+, nicotinamide, N-methyl-nicotinamide, 2PY, and 4PY contents before (white bars) and after placebo or NMN treatment (gray bars). Two-way mixed model analysis of variance (ANOVA) with time (before- versus after- treatment) and group (placebo versus NMN) as factors was used to compare the effect of treatment with NMN and placebo on basal PBMC and tissue NAD+. A significant time by group interaction is followed by Tukey’s post-hoc test to locate significant mean differences. A t-test for independent samples (two-tailed) was used to determine differences between the mean PBMC AUC values in the two groups. *Value significantly different from corresponding before treatment value, P <0.01. **Value significantly different from corresponding before treatment value, P <0.05. †Value significantly different from corresponding value in the placebo group, P <0.01. Circles represent individual participant values: skeletal muscle NAD+ content was measured in 11 placebo and 12 NMN participants; skeletal muscle NMN metabolites were measured in 11 placebo and 10 NMN participants; all other measurements are in 12 placebo and 13 NMN participants. Bars represent means ± SEM.
