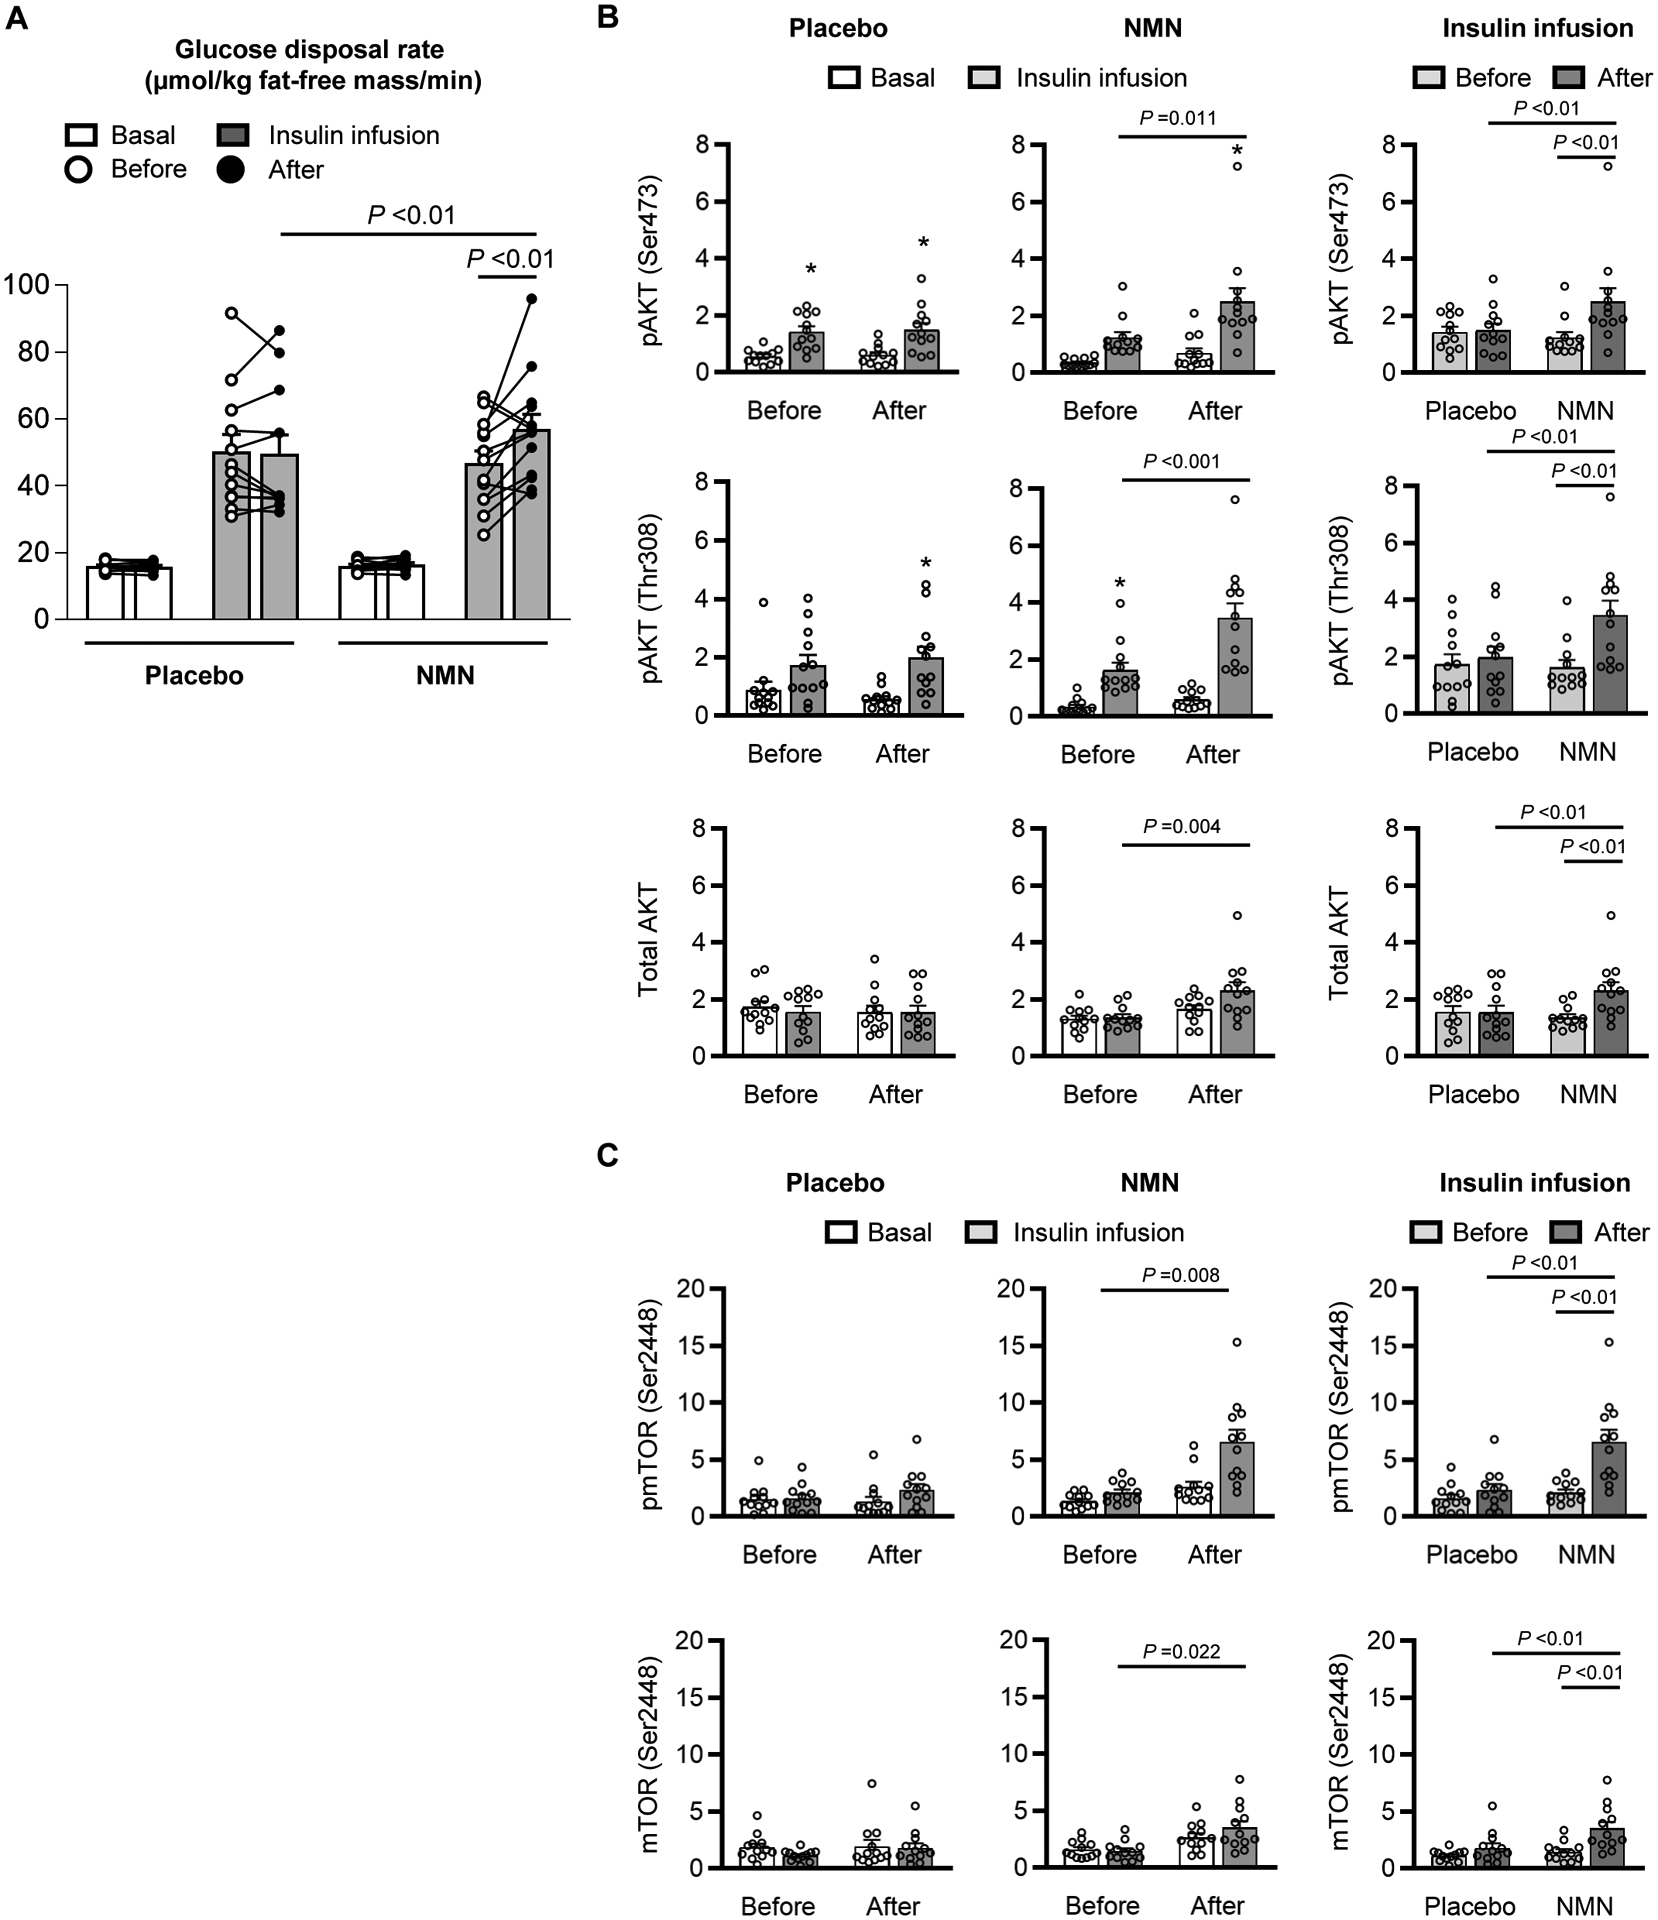
Figure 2. Effect of NMN on skeletal muscle insulin sensitivity and signaling.

A, Muscle insulin sensitivity, assessed as glucose disposal rate during basal conditions (white bar) and insulin infusion (gray bar) of a hyperinsulinemic-euglycemic clamp procedure. A three-way mixed model ANOVA with time (before- vs after- treatment), condition (basal vs insulin infusion), and group (placebo vs NMN) as factors, was used to compare the effect of NMN (n=13) and placebo (n=12) treatment on insulin-stimulated glucose disposal rate. A significant three-way interaction (P =0.022) was followed by Tukey’s post-hoc test to locate significant mean differences. Significant differences in mean values are represented by a line above the bars with the corresponding P value. B, Western blot densitometric analyses of phosphorylated AKT serine-473 (pAKT Ser473), threonine-308 (pAKT Thr308) and mTOR serine-2448 (pmTOR Ser2448), and total AKT and mTOR relative to ACTIN in skeletal muscle during basal conditions and insulin infusion before and after 10 weeks of treatment with placebo (n=12) or NMN (n=12). Raw images for individual Western blot analysis are provided in the supplementary materials (Figure S3). One-way ANOVA was performed to determine differences in the quantity of phosphorylated AKTs among each combination of time and condition (during basal and insulin infusion before and after each treatment) within each group. Following a significant omnibus test, Tukey’s post-hoc test was used to locate significant mean differences. C, Western blot densitometric analyses of pAKT Ser473, pAKT Thr308, pmTOR Ser2448, and total AKT and mTOR relative to ACTIN in skeletal muscle during insulin infusion before (light gray bars) and after (dark gray bars) placebo (n=12) or NMN (n=12) treatment. Two-way mixed model ANOVA with time (before- vs. after- treatment) and group (placebo vs NMN) as factors was used to determine the significance of differences between variables. A significant two-way interaction was followed by Tukey’s post-hoc test to locate significant mean differences. Significant differences in mean values are represented by a line above the bars with the corresponding P value. *Value significantly different from the corresponding basal value, P <0.05. Circles represent individual participant values. Bars represent means ± SEM.
