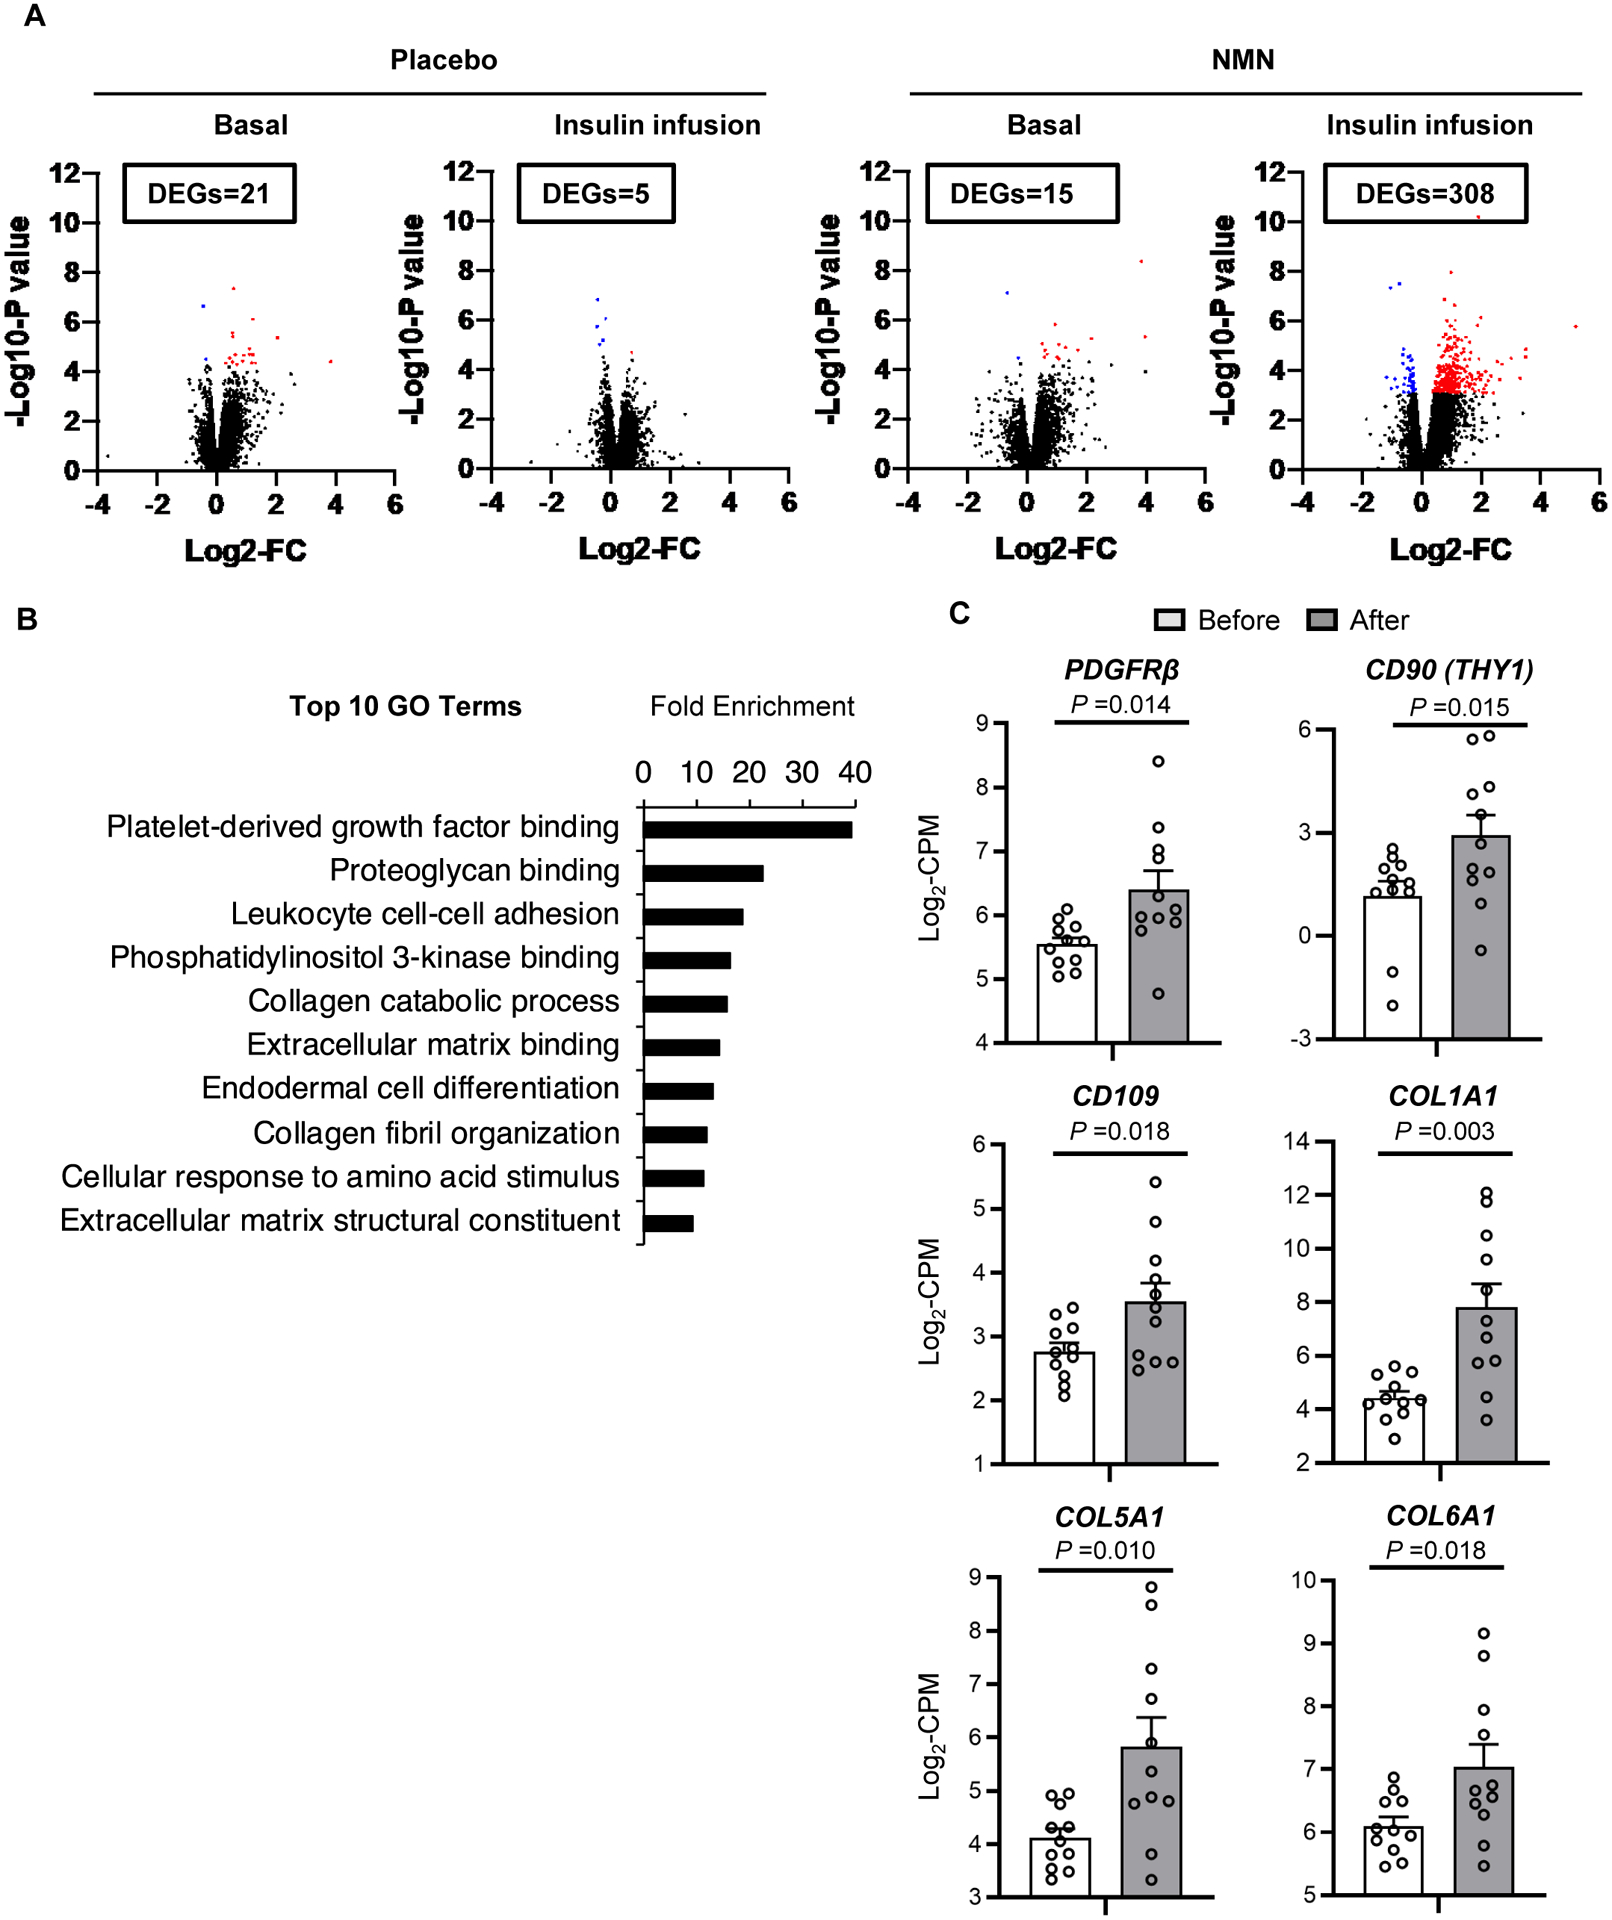
Figure 3. Effects of NMN on skeletal muscle global transcriptome profile.

Skeletal muscle tissue obtained during basal conditions and insulin infusion before and after treatment in placebo (n=12) and NMN groups (n=11) were evaluated by using RNA-sequencing (RNA-seq). A, Volcano plots of RNA-seq data of skeletal muscle with log2-fold change (FC) (X-axis) and -log10-P value (Y-axis). The number of differentially expressed genes (DEGs, FDR<0.05) between before and after treatment during basal conditions and during insulin infusion are shown in boxes in each panel. Significantly up-regulated and down-regulated DEGs between before and after treatment in the placebo and NMN groups are shown as red and blue dots, respectively. B, The top 10 Gene Ontology (GO) terms ranked by fold-enrichment. C, Skeletal muscle gene expression of selective proteins involved in PDGF signaling and muscle remodeling during insulin infusion before and after NMN treatment in each participant. PDGFRβ, CD90, CD109, COL1A1, COL5A1, and COL6A1 were identified as DEGs (Table S2). Gene expression is presented as log2-transformed counts per million (CPM) reads. Lines represent values of individual participants before and after NMN treatment. A t-test for paired samples (two-tailed) was performed to determine the difference between before and after NMN treatment for each gene; corresponding P values are indicated above the black lines.
