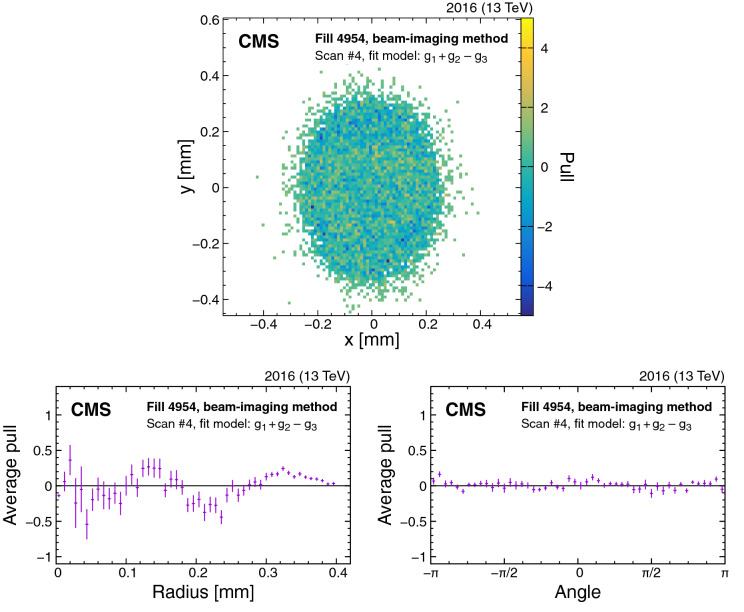
Fig. 11.
Example of the pull distributions of the fit model of Eq. (22) with respect to the vertex distribution that constrains beam 2 in the y direction recorded in fill 4954. The upper plot shows the two-dimensional pull distributions, and the lower plots show the per-bin pulls averaged over the same radial distance (lower left) or angle (lower right). The error bars in the lower plot denote the standard error in the mean of the pulls in each bin. The fluctuations observed in the radial projection of the residuals are included in the uncertainty estimation

