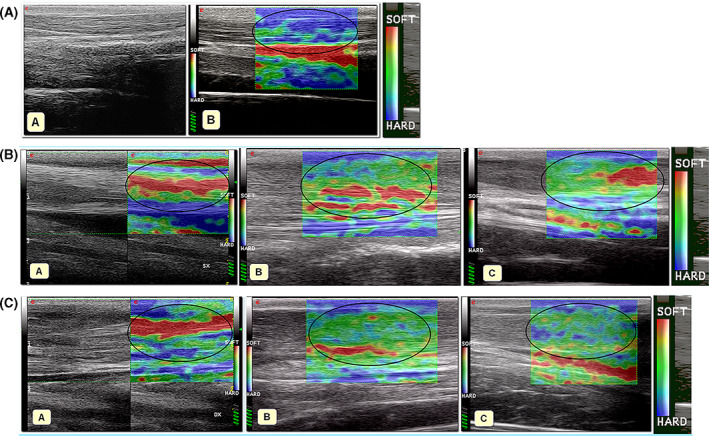
FIGURE 4.

A, B‐mode (A) and sonoelastographic (B) appearance of the normal CCT. Normal CCT is mostly hard, which is represented in color‐coded map in blue (encircled in black); B, B‐mode and sonoelastographic features of CCT 15 days after the iatrogenic lesion in a subject of non‐treated group (A). The elastogram of CCT was mostly red (soft). The same tendon at 1‐month follow‐up (B) and 2‐month follow‐up (C): the elastogram was mostly green (intermediate elastographic features) with areas of red (softness, encircled in black). C, B‐mode and sonoelastographic features of the CCT 15 days after the iatrogenic lesion in a subject of treated group (A). The elastogram was mostly red (soft areas, encircled in black). The elastogram of the same tendon at 1‐month follow‐up (B) was mostly green (intermediate elastographic features, encircled in black). The elastogram of the same tendon at 2‐months follow‐up (C) was green (intermediate sonoelastographic features) with several areas of blue (areas of hardness, encircled in black)
