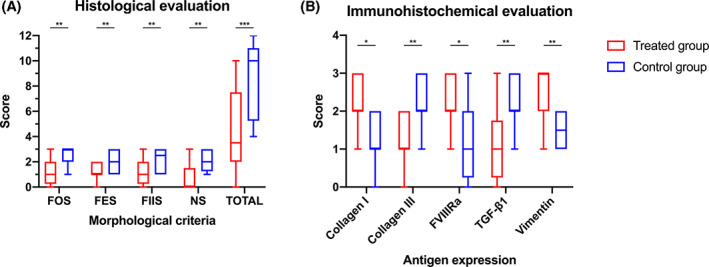
FIGURE 5.

A, Histological score of excised tendons at the end of the study (T2) in treated group and control group. FOS: fiber orientation score; FES: fiber edema score; FIIS: infiltrative‐inflammatory score; NS: necrosis score; TOTAL: total score; B, Immunohistochemical score of excised tendons at the end of the study (T2) in treated group and in control group. The ends of the whiskers show minimum and maximum score values; boxes show the median, the first and the third quartile; P‐values, ns: not significant; *P < .05; **P < .01; ***P < .001; ****P < .0001
