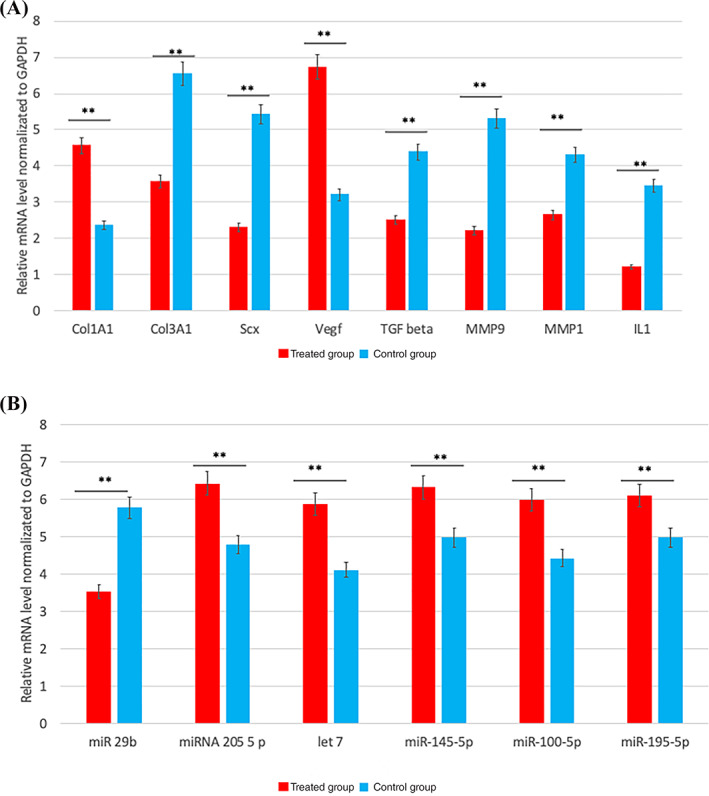
FIGURE 7.

Semiquantitative analyses of gene expression of Col1a1 (collagen type I), Col3a1 (collagen type III), Scx (sclerodermin) Vegf (vascular endothelial growth factor); TGF beta (transforming growth factor), Mmp1 (metalloproteinase 1), Mmp9, interleukin 1 (IL1), miRNA group involved on xenogenesis such as miR 29b, miRNA 205 5 p, let 7, miR‐145‐5p miR‐100‐5p, miR‐195‐5p in treated (group A in red), and no treated (group b in blue) group. Data were quantified and normalized by using the quantitative real‐time polymerase chain reaction (RT‐qPCR) procedure. Each bar represents the fold change (FC) SD of the normalized values. Repeated‐measures ANOVA with a post hoc analysis using Bonferroni's multiple comparison. T tests were used to determine significant differences (P = .05). *P = .05; **P = .01; ***P = .001. Repeatability was calculated as the SD of the difference between measurements
