FIGURE 2.

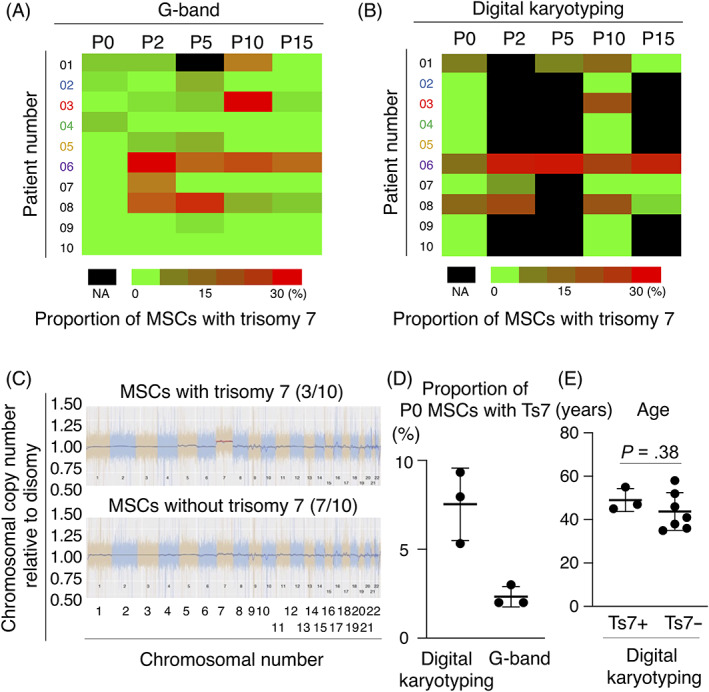
Proportion of number of MSCs with trisomy 7 to total number of MSCs. A, The proportion of MSCs with trisomy 7 in 100 cells at P0 to P15 by the G‐band method in 10 patients. B, The proportion of chromosome 7 copy number to disomic chromosome 7 copy number by digital karyotyping in P0 to P15 MSCs in 10 patients. C, Representative results of the proportion of chromosomal copy number to disomic chromosomal copy number obtained by digital karyotyping of P0 MSCs with/without trisomy 7. D, The proportion of chromosome 7 copy number to disomic chromosome 7 copy number obtained by digital karyotyping and the G‐band method in P0 MSCs with trisomy 7 in three patients. Average ± SD is shown (n = 3). E, The age distribution of patients who had and did not have trisomy 7 in P0 MSCs defined by the G‐band method. Average ± SD is shown (Ts7+; n = 3, Ts7−; n = 7). The P value was determined by the Mann‐Whitney U test. MSCs, mesenchymal stem cells; NA, not assigned; Ts7: trisomy 7; Ts7+, patients having MSCs with trisomy 7; Ts7−, patients having MSCs without trisomy 7
