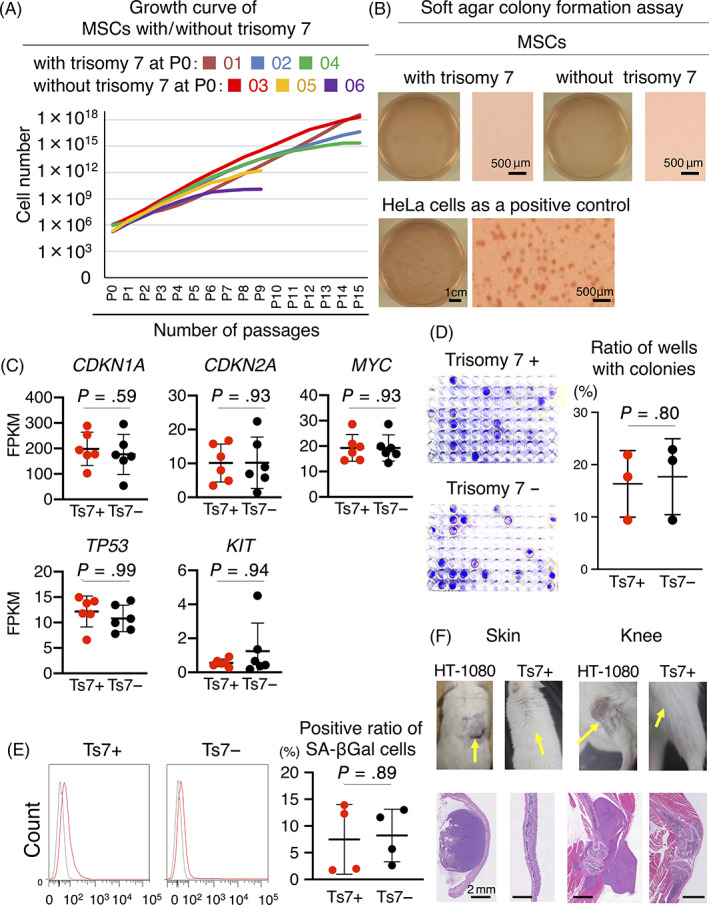
FIGURE 3.

Safety tests for MSCs with trisomy 7. A, Growth curve of MSCs with/without trisomy 7. B, Soft agar colony formation assays for MSCs with/without trisomy 7 and for HeLa cells. C, mRNA expression of oncogenes. Average ± SD is shown (n = 6). P values were determined by the Mann‐Whitney U test. D, Clonogenic assay of MSCs with/without trisomy 7. One cell of patients 02 and 03 at P5 was plated in a well of a 96‐well plate. The colonies containing more than 10 cells were considered positive. Representative images of 96‐well plates at 21 days of culture and the rate of wells with colonies are shown. Average ± SD is shown (n = 3). P values were determined by the Mann‐Whitney U test. E, Senescence‐associated β‐gal assay of MSCs with/without trisomy 7 at P5. Representative histograms from flow cytometric analysis for SA‐β‐gal positive cells are shown in red and for isotype control in gray. The positive ratio of SA‐β Gal cells is also shown as average ± SD (n = 4). P values were determined by the Mann‐Whitney U test. F, Transplantation of MSCs with trisomy 7 into subcutaneous tissues and knee joints of mice. HT‐1080 cells were used as a positive control. Images were taken 8 weeks after transplantation for MSCs and when the tumor had grown to a maximum diameter of 10 mm for HT1080 cells. Injection sites are indicated by arrows. CDKN1A, cyclin‐dependent kinase inhibitor 1A; CDKN2A, cyclin‐dependent kinase inhibitor 2A; FPKM, fragments per kilobase of transcript per million fragments sequenced; MSCs, mesenchymal stem cells; MYC, MYC proto‐oncogene, bHLH transcription factor; SA‐β‐gal, senescence‐associated beta‐galactosidase; TP53, tumor protein p53; KIT, KIT proto‐oncogene, receptor tyrosine kinase
