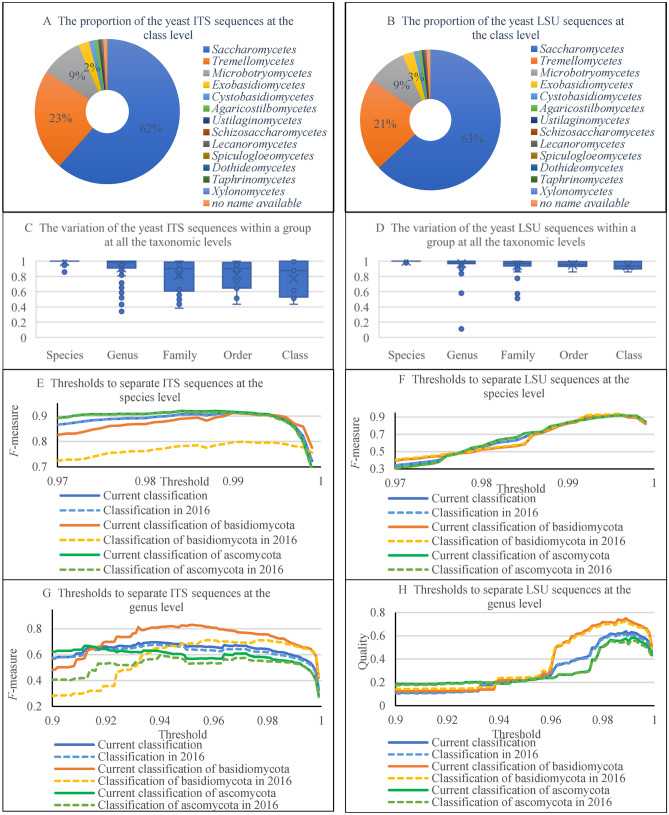
Fig. 2.
Analysis of ITS1 + 2 and D1/D2 LSU ribosomal RNA gene sequences of yeasts. A, B Proportion of yeast ITS and LSU sequences at the class level. C, D Variation of the median ITS and LSU sequence similarity scores of yeasts at various taxonomic levels. E–H Optimal thresholds and associated highest F-measures predicted at the species and genus levels from a previous analysis (Vu et al. 2016) and a current dataset updated based on recent taxonomic revisions (date of analysis December 2020). The sequences were compared with each other using BLAST (Altschul et al. 1997). For each of the resulting local alignments of two sequences, a BLAST similarity score was calculated as the percentage of matches s if the alignment length l was greater than 300 bp (the minimum length of ITS sequences, Vu et al. 2019). Otherwise, the score was recomputed as . The names of the taxa associated with the sequences were downloaded from MycoBank (Robert et al. 2013)

