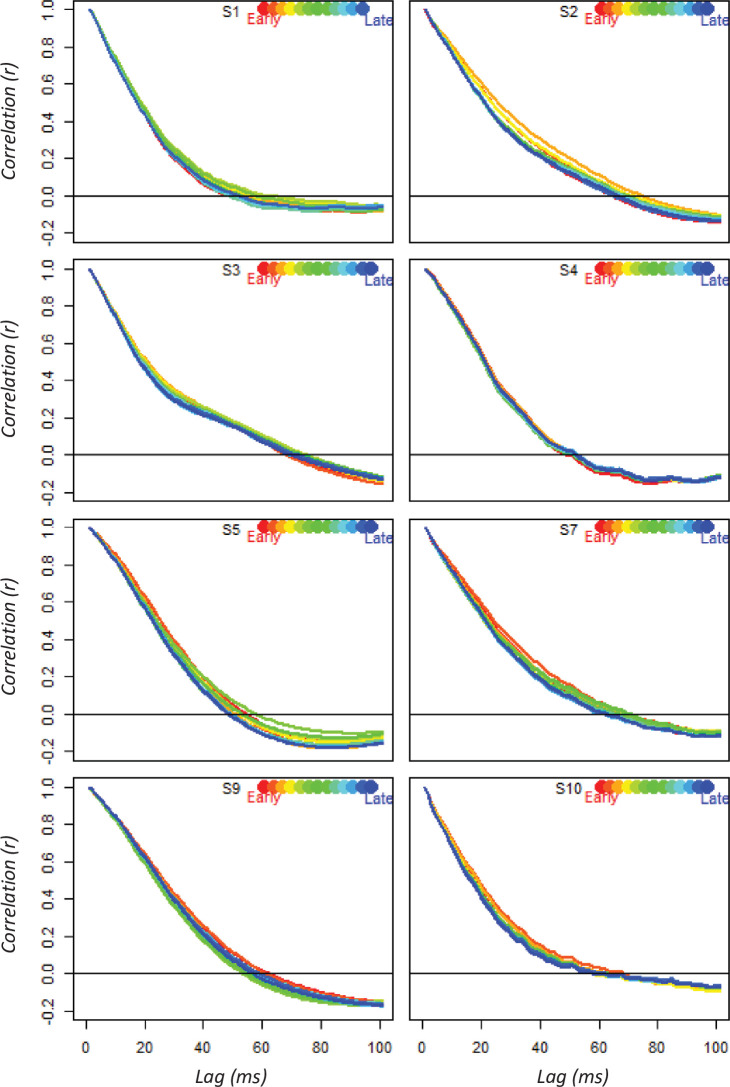
Appendix 1—figure 6. Temporal autocorrelation.
Each panel shows the mean temporal autocorrelation curves for a 300 ms moving window, averaged over all electrodes for each subject. If VPs auto-correlate over an increasingly wide temporal window, then later curves would show a broader envelope than earlier curves. Instead the different windows sit on top of one another, showing temporal autocorrelation that decays to zero after about 60 ms.

