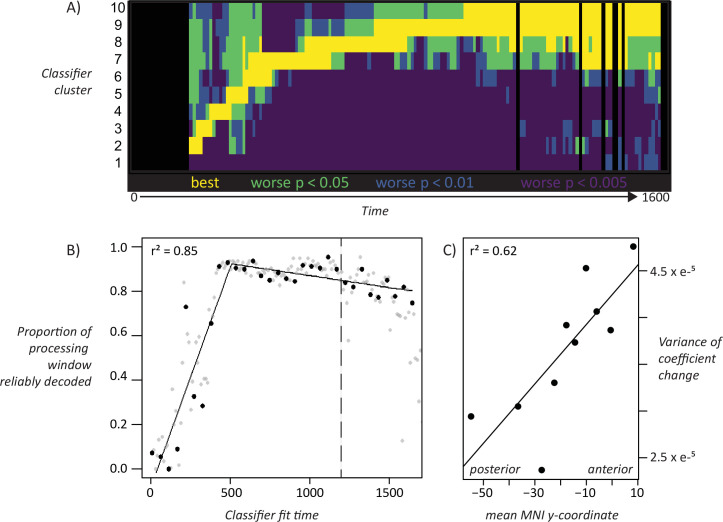
Figure 5. Statistical assessment of key patterns.
A. Statistical assessment of ‘overlapping waves’ pattern. Each row corresponds to one cluster of decoding models as shown in Figure 4C. Black vertical lines indicate timepoints where decoding is not reliable across subjects. Yellow shows the best-performing model cluster and other clusters that statistically perform as well. Green, blue, and purple indicate clusters that perform reliably worse than the best-performing cluster at increasingly strict statistical thresholds controlling for a false-discovery rate of 0.05. B. Broadening window of generalization. For classifiers fit at each time window, breadth of classifier generalization (as proportion of full processing window) is plotted againt the time at which the classifier was fit. The line shows a piecewise-linear model fit to 32 non-overlapping time windows (black dots). The most likely model had a single inflection point at 473 ms post stimulus-onset, with breadth of generalization increasing linearly over this span, then hittng ceiling through most of the remaining processing window. The dashed line shows mean response latency. C. Fluctuating codes in more anterior regions. Correlation between mean variance of coefficient change (see text) and anterior/posterior electrode location for electrodes grouped by decile along the anterior/posterior axis.

