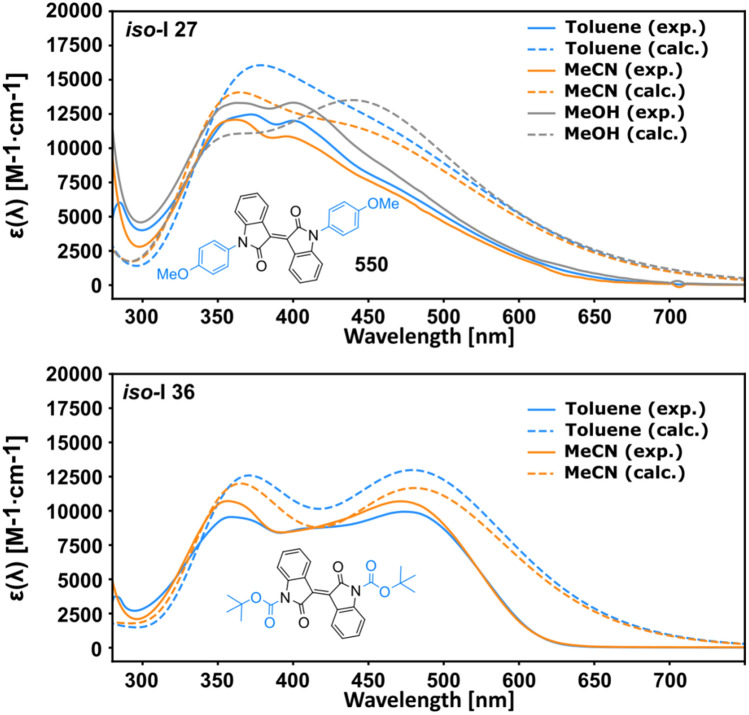
Fig. 4.
Experimental (solid lines) and calculated spectra (dashed lines) in the respective solvents are in good accordance. Both the vertical excitation energies and the overall shape is met with good accuracy. The S0 → S1 transition at ca. 475 nm in iso-I-27 does not correspond to a local maximum in both calculated and experimental spectra. The high attenuation of iso-I-36 was very accurately described by the TD-DFT model, along with the excellent prediction of the vertical excitation energy in toluene, tailing into the NIR

