
Figure 2.
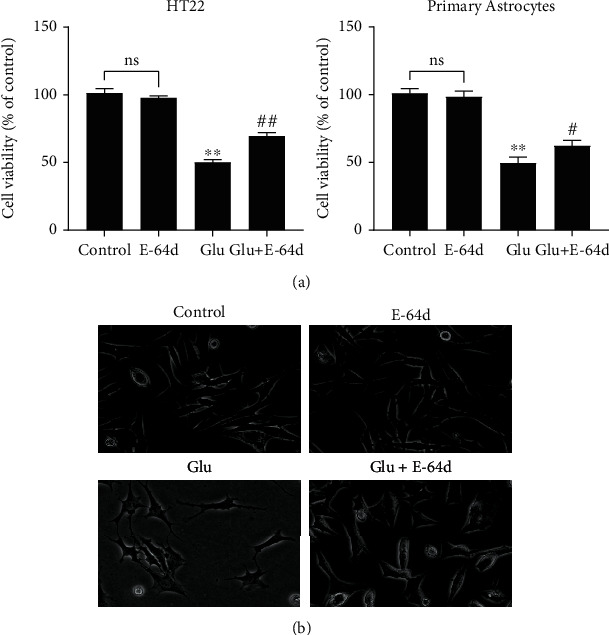
Protective effect of E-64d on glutamate-induced injury in HT22 cells and primary astrocytes. (a) Cell viability was evaluated via the CCK-8. (b) Observation of HT22 cell morphology in each group via light microscopy (×10). The data are expressed as the mean ± SD. ∗∗P < 0.01 vs. the Control group. #P < 0.05, ##P < 0.01 vs. the Glutamate group. n.s.: not significant.