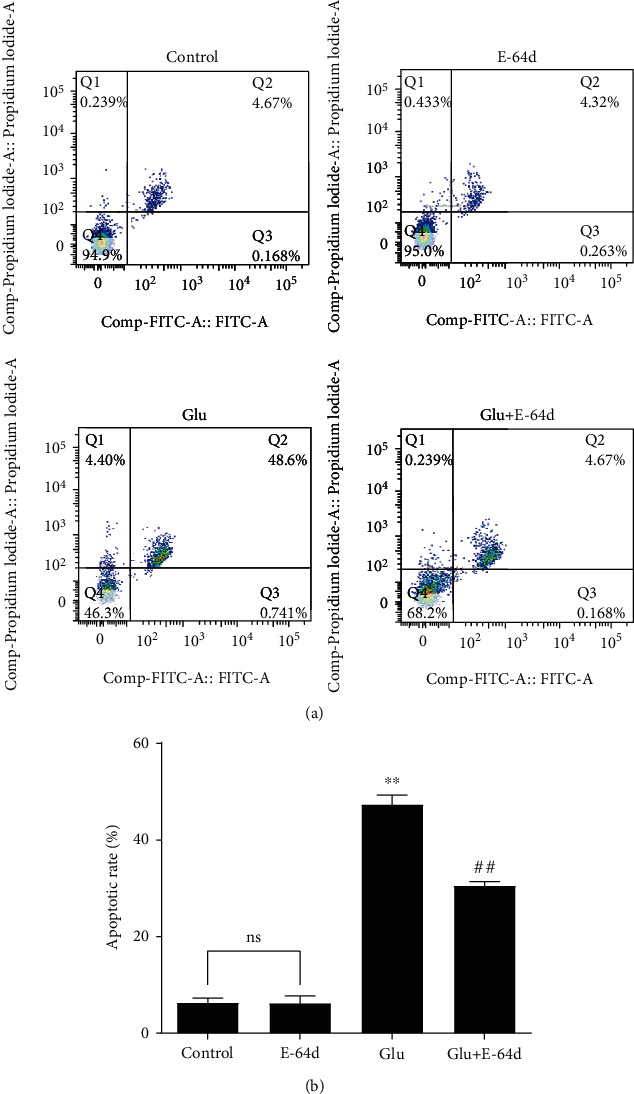
Figure 3.

Apoptosis rates of glutamate-treated HT22 cells following 24 h of exposure to E-64d. (a) The cell apoptosis rate was measured via flow cytometry. (b) Quantitative analysis of the apoptosis rate in cells. Three independent experiments were performed, and the data are expressed as the mean ± SD. ∗∗P < 0.01 vs. the Control group. ##P < 0.01 vs. the Glutamate group. n.s.: not significant.
